Weather Bar Graph - Market Status Analysis
RJ0600106_20
- Last Update 07/19/2025
- File Size 1.2MB
- # of Slides 2
- File Format PPTX
- Slide Ratio 16:9
- Color
Keywords
About the Product
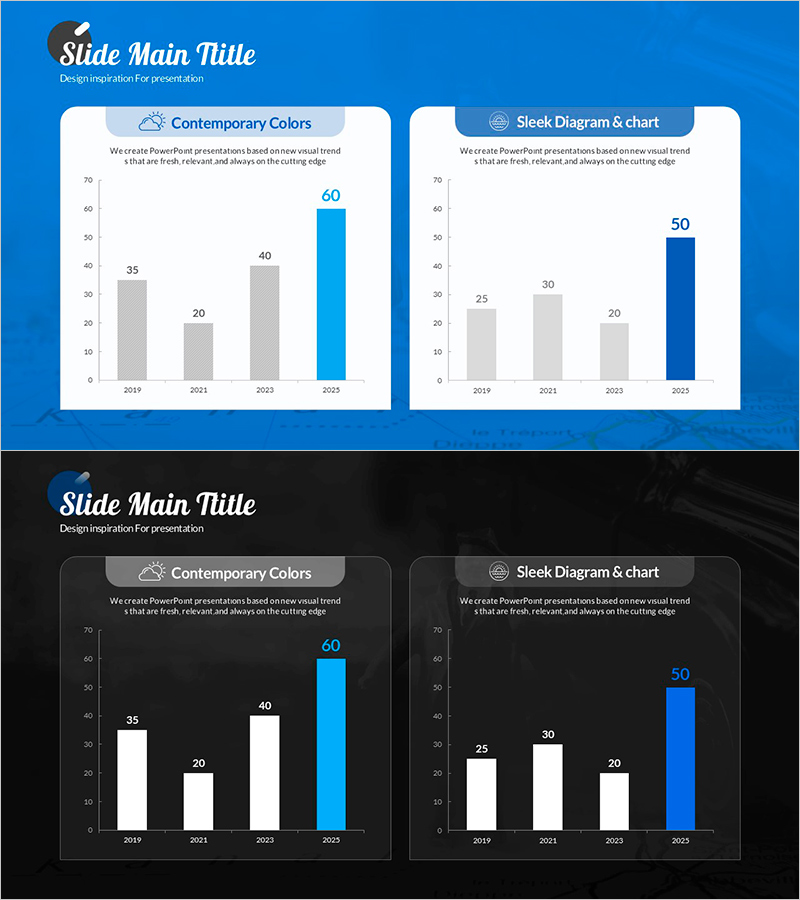
A vertical bar chart PowerPoint slide designed for market status analysis and competitive advantage assessment. This presentation template visualizes numerical changes across four years from 2019 to 2023, with the latest data highlighted in bright blue to emphasize growth trends intuitively. The card-style layout on a white background integrates seamlessly into presentations, while clear axis labels and data values enhance audience comprehension during delivery. The 2-slide set includes both light and dark background versions, enabling adaptation to various presentation environments and display settings.
Usage Points
-
Main Usage
Optimized for comparing numerical values across years, quarters, or categories while visualizing growth trends. The accent color on the final data point emphasizes recent performance or goal achievement, making it ideal for market analysis, sales reporting, competitive benchmarking, and business presentations.
-
How to Use
Double-click the displayed values to edit directly, or right-click the chart and select 'Edit Data' to input new figures. Use the light background version for daytime meetings and formal presentations, and the dark background version for evening events or dark-themed presentations.
-
Recommended For
Marketing managers, sales directors, financial analysts, and executives presenting market trends, sales performance, and financial results. Suitable for business plans, quarterly performance reports, investor pitch decks, and management meeting materials.
-
Slide Structure
Two-slide set with identical chart structure. Vertical axis ranges 0–70, horizontal axis displays four years (2019, 2021, 2023, 2023), and four data points (35, 20, 40, 60) with the final value highlighted in bright blue. Card-style containers and icon headers enhance professional appearance.
Related Products
-

Tourist Destination Preference Analysis – Stylish Bar Chart Design
#Market and Competitor Analysis #Graph #Market Status
-

Backpack Travel Vertical Bar Graph – Market Status and Competitive Advantage
#Market and Competitor Analysis #Graph #Market Status
-

Bar Chart Visualizing Yacht Tour Satisfaction
#Market and Competitor Analysis #Graph #Other
-

3D Bar Graph for Market Performance Analysis – Slide Highlighting Competitive Edge
#Market and Competitor Analysis #Graph #Market Status
