Weather Change Vertical Bar Graph Analysis - Understanding Market Status
RB0100011_5
- Last Update 03/02/2025
- File Size 0.8MB
- # of Slides 2
- File Format PPTX
- Slide Ratio 4:3
- Color
Keywords
About the Product
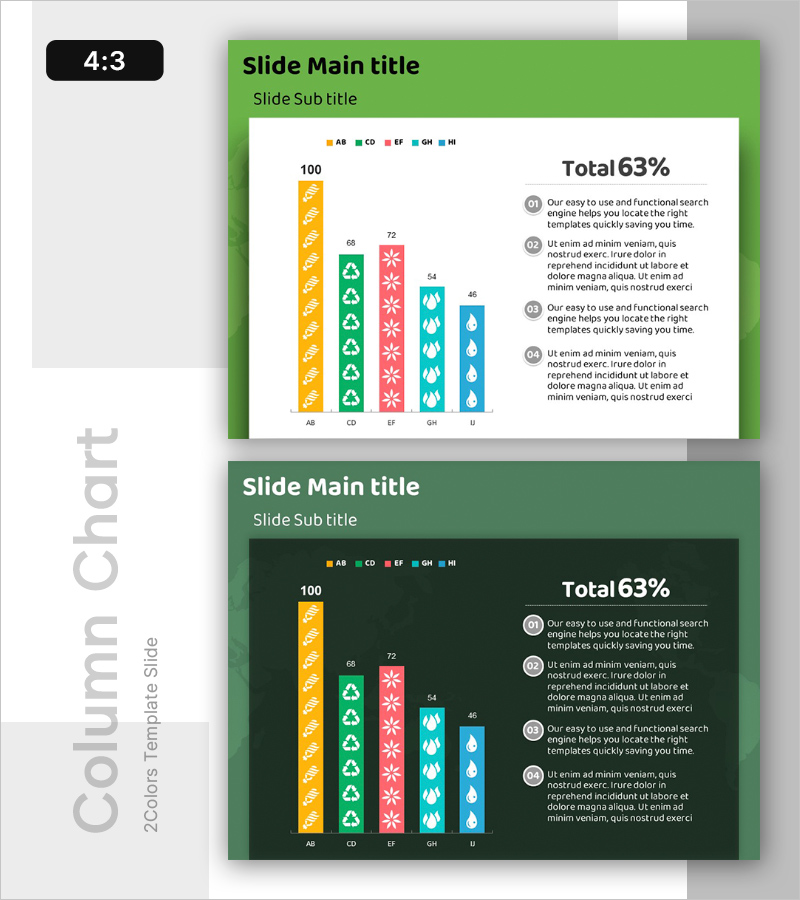
A PowerPoint slide featuring five vertical bars comparing numerical data across five categories. Each bar is color-coded in yellow, green, pink, cyan, and blue, with icons embedded within each bar to represent categories visually. The right side includes four numbered text boxes for detailed analysis, while the top legend and total percentage display provide an at-a-glance overview. This slide template is ready to use for market analysis, competitive benchmarking, weather trend analysis, and other business presentations requiring data comparison.
Usage Points
-
Main Usage
This slide visualizes numerical comparisons across five categories using vertical bars, ideal for presenting market conditions, competitive positioning, weather patterns, or sales performance. Icons within each bar clarify category identity, while numbered text boxes on the right enable detailed analytical commentary.
-
How to Use
Reference the top legend to identify each series by color. Compare bar heights to assess relative values. Fill the four numbered sections on the right with analysis insights, interpretations, and conclusions. Suitable for business plans, marketing proposals, market reports, and executive presentations.
-
Recommended For
Marketing professionals, business analysts, strategists, and executives presenting market trends, competitor analysis, weather data, or sales figures. Ideal for business presentations, quarterly reports, proposal decks, and strategic planning documents requiring quantitative data visualization.
-
Slide Structure
Two-slide layout with five vertical bars (yellow, green, pink, cyan, blue) on the left, embedded category icons, top legend, total percentage display (Total 63%) on the right, and four numbered analysis text boxes (01–04) for commentary.
Related Products
-

Data Visualization with Market Analysis Vertical Bar Graph
#Market and Competitor Analysis #Graph #Market Status
-

Horizontal Bar Chart Slide for USA Market Analysis
#Market and Competitor Analysis #Graph #Other
-

Consumer Insights & Behavioral Patterns Analysis Slide
#Market and Competitor Analysis #Graph #Market Status
-

Horizontal Bar Chart for Recent Case Receipt Trends – Market Status
#Market and Competitor Analysis #Graph #Market Status
