Data Network Service Configuration Diagram – Technical Efficiency
RJ0400005_11
- Last Update 05/18/2025
- File Size 0.2MB
- # of Slides 2
- File Format PPTX
- Slide Ratio 16:9
- Color
Keywords
About the Product
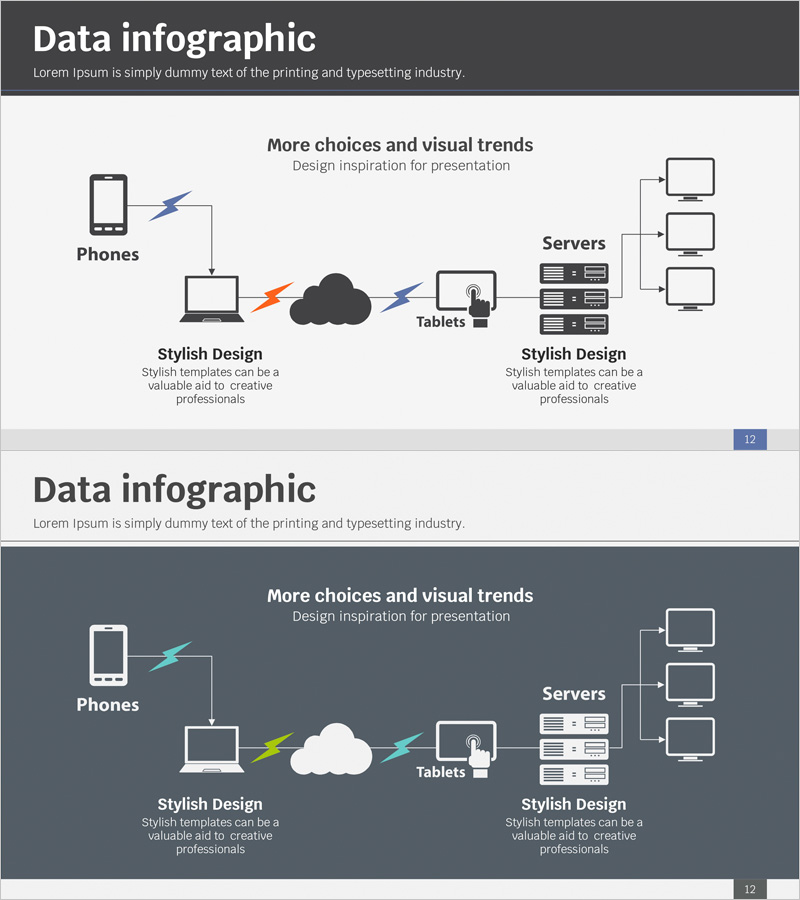
A network architecture PowerPoint slide featuring five interconnected nodes: smartphone, laptop, cloud, tablet, and servers, connected with bidirectional arrows. Orange and blue directional arrows clearly represent data flow patterns, while the left device cluster and right server cluster demonstrate hierarchical system organization. This presentation template is ready to use for IT technology briefings, cloud service introductions, and network infrastructure explanations. Includes 2 slides in 16:9 widescreen PPTX format.
Usage Points
-
Main Usage
Visually communicate cloud services, network infrastructure, and IT system architecture. The bidirectional arrows clearly show data flow and connection relationships between smartphones, laptops, tablets, cloud platforms, and servers, making complex technical concepts accessible to audiences.
-
How to Use
Customize the diagram for IT technology presentations, cloud service pitches, network infrastructure documentation, system architecture explanations, and technical department reports. Modify node labels, arrow colors, directions, and text to match your specific system structure and data flow requirements.
-
Recommended For
IT technology teams, cloud service managers, network engineers, system architects, and technical marketing professionals presenting to stakeholders. Ideal for technical proposals, internal reports, client presentations, and seminars where clear system visualization is essential.
-
Slide Structure
Two-slide set with light gray background on slide 1 and dark gray on slide 2. Each features five nodes arranged in left device cluster and right server cluster, connected by orange and blue bidirectional arrows representing data flow. Dual-theme design allows selection based on presentation environment and audience preference.
Related Products
-

Sound Service Configuration Diagram – Visualizing System Flow
#Technical Approach #Diagram #Service Architecture Diagram
-

Service Construction and Configuration Diagram – Visualizing Business Processes
#Technical Approach #Diagram #Service Architecture Diagram
-

Internet Security Platform Structure Diagram – Stability and Innovation
#Business Strategy #Technical Approach #Diagram
-

Network Firewall Service Configuration and Execution
#Technical Approach #Diagram #Service Architecture Diagram
