Sound Service Configuration Diagram – Visualizing System Flow
RJ0400008_7
- Last Update 05/19/2025
- File Size 2.1MB
- # of Slides 2
- File Format PPTX
- Slide Ratio 16:9
- Color
Keywords
About the Product
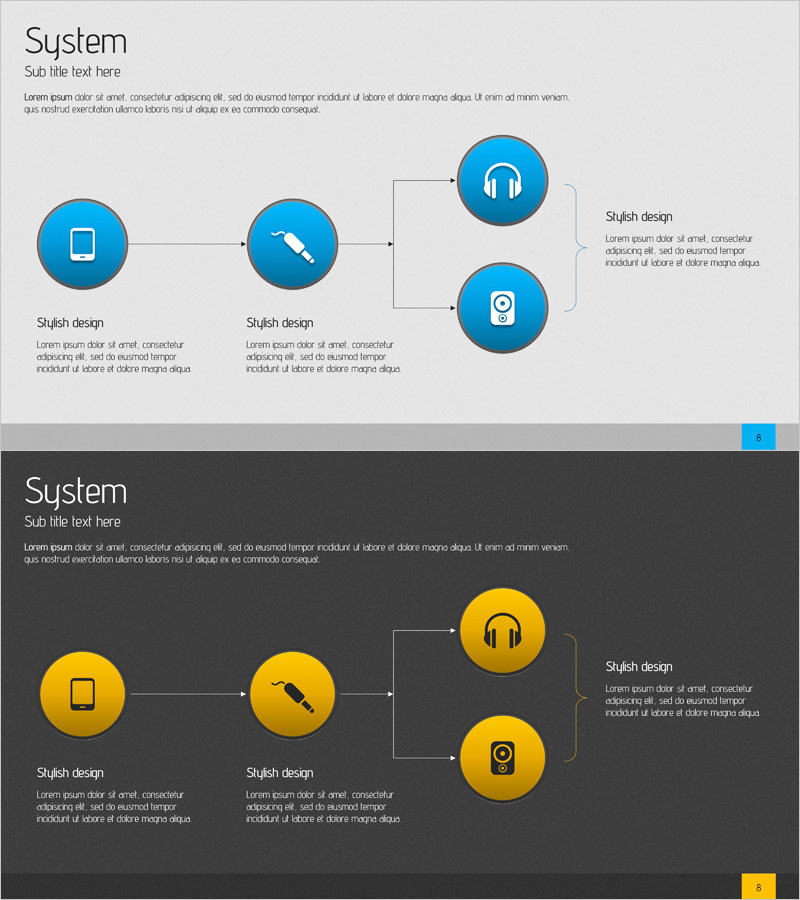
A linear flow diagram PowerPoint slide visualizing an audio service system with 3 nodes and directional arrows. Device icons (smartphone, cable, headphones, speaker) are placed in circular nodes with sequential connection structure to illustrate system architecture. Light gray background combined with blue-toned circular nodes and white text boxes clearly represents information flow. Includes 2 slide versions: light and dark background, optimized for 16:9 widescreen ratio in PPTX format. Ready to use for technology presentations, system architecture explanations, and service configuration diagrams.
Usage Points
-
Main Usage
Optimized for explaining linear process flows in audio services, technology systems, and IoT device connectivity. Clearly expresses sequential relationships across 3 stages to enhance audience comprehension. Ideal for technology presentations, system architecture explanations, and service configuration sections.
-
How to Use
Double-click circular nodes and text boxes to freely edit icons and text content. Maintain arrow direction and node layout while adjusting colors, fonts, and icons to match your presentation brand. Use light background version for bright venues and dark background version for low-light environments.
-
Recommended For
Recommended for technology managers, system engineers, product planners, and IoT service specialists explaining technical flows. Suitable for audio/streaming service companies' technology presentations, system integration proposals, and technical training materials. Also applicable for investor-facing technical explanation slides.
-
Slide Structure
2-slide set featuring light gray background version and dark gray background version. Each slide displays 3 blue-toned circular nodes with icons arranged left to right, connected by directional arrows showing sequential flow. Right side includes text box areas for adding stage descriptions. Optimized for 16:9 widescreen format.
Related Products
-

Internet Security Platform Structure Diagram – Stability and Innovation
#Business Strategy #Technical Approach #Diagram
-

Service Composition Diagram – Technical Application and Visualization
#Technical Approach #Diagram #Service Architecture Diagram
-

Data Network Service Configuration Diagram – Technical Efficiency
#Technical Approach #Diagram #Service Architecture Diagram
-

Network Firewall Service Configuration and Execution
#Technical Approach #Diagram #Service Architecture Diagram
