Service Construction and Configuration Diagram – Visualizing Business Processes
RJ0400010_18
- Last Update 05/19/2025
- File Size 0.4MB
- # of Slides 2
- File Format PPTX
- Slide Ratio 16:9
- Color
Keywords
- #Content-Based Slides
- #Design-Based Slides
- #Technical Approach
- #Diagram
- #Service Architecture Diagram
- #Service Implementation Plan
- #Flow
- #Linear Flow
- #16:9
- #linear flow diagram PowerPoint
- #business process flowchart
- #service construction slide
- #4-step process diagram
- #how to create process flow in PowerPoint
About the Product
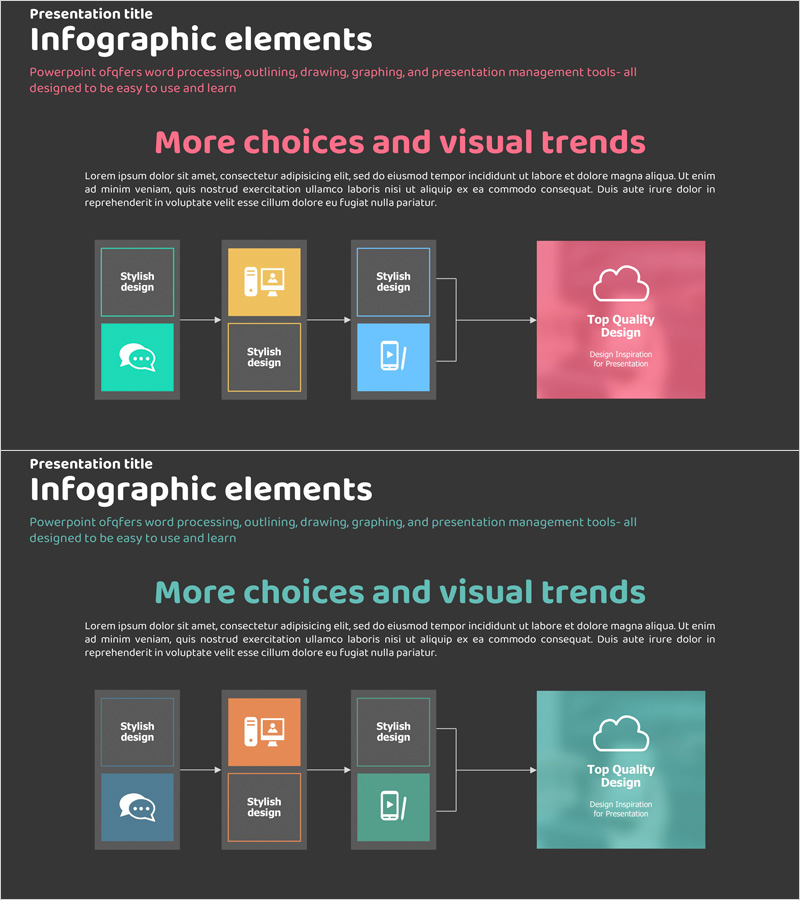
A PowerPoint slide featuring a 4-step linear flow diagram that visualizes service construction and configuration processes. Set against a dark gray background, four colored boxes in pink, orange, blue, and teal are connected by arrows to clearly represent sequential business processes. Each step includes icon areas and text fields for effective communication of technology strategies, service development phases, and system implementation workflows. The 2-slide set provides both pink and teal background variations, optimized for 16:9 widescreen format across all presentation environments. Fully editable in PPTX format, allowing flexible customization of text and colors.
Usage Points
-
Main Usage
Clearly visualizes sequential stages of service development, system implementation, and business processes. Ideal for technology strategy presentations, product development roadmaps, and implementation procedure explanations to enhance audience comprehension.
-
How to Use
Enter step titles and descriptions in each box, and customize icons as needed. Select color variations (pink or teal background) to match your document tone, and arrange slides by presentation section to emphasize process flow.
-
Recommended For
Suitable for presentations by technology professionals, product managers, and strategy planning teams. Effective for IT company technical explanations, startup service introductions, and engineering team implementation plan sharing.
-
Slide Structure
2-slide set. Each slide features 4 nodes (boxes) connected left-to-right by arrows in a linear sequence. Each node includes icon areas and text input fields, with color variations (pink and teal backgrounds) provided.
Related Products
-

Typographic Wide Template Flow Diagram1 – Business Operational Strategy
#Operational Plan #Technical Approach #Diagram
-

Service Composition Diagram – Technical Application and Visualization
#Technical Approach #Diagram #Service Architecture Diagram
-

Linear Flow Diagram for Service Implementation Plan
#Operational Plan #Technical Approach #Diagram
-

Sleek Presentation Template Emphasizing Business Context
#Business Strategy #Operational Plan #Technical Approach
