Competitor Analysis and Market Trend Graph – Blue, Orange, Green Colors
RJ0400017_29
- Last Update 05/22/2025
- File Size 0.4MB
- # of Slides 2
- File Format PPTX
- Slide Ratio 16:9
- Color
Keywords
About the Product
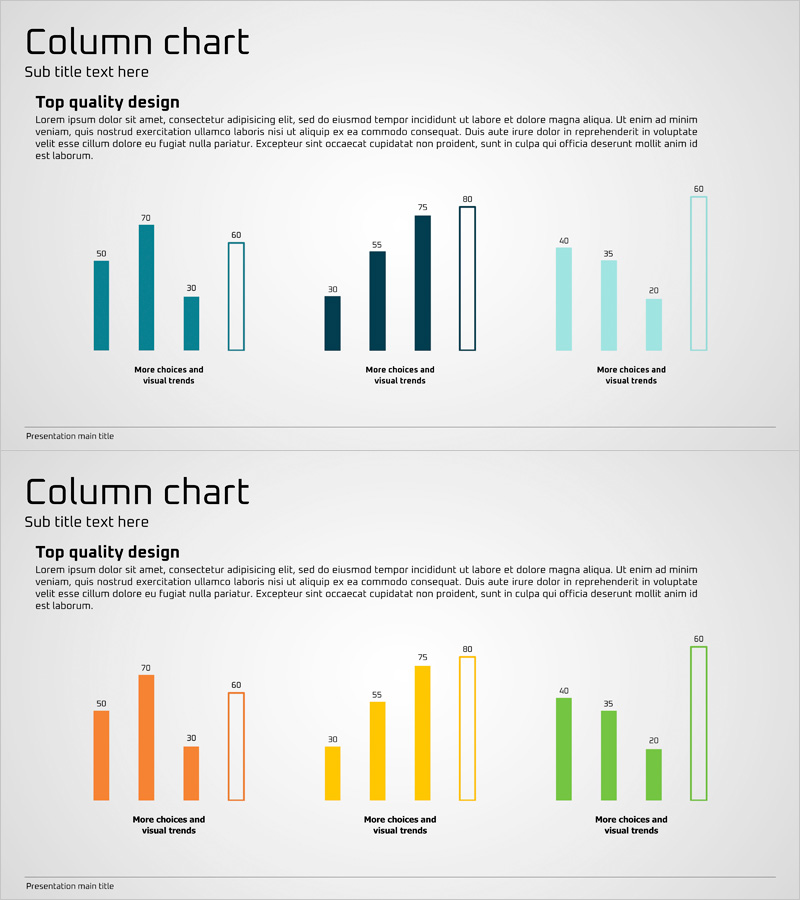
A free column chart PowerPoint slide for comparing competitor analysis and market trends at a glance. With a clear visualization structure using three distinct colors—blue, orange, and green—you can replace text and numbers to instantly insert this presentation slide into your business documents. Fully editable in PowerPoint, this slide works seamlessly in business plans, reports, and proposals. As a single-slide download, you can quickly build the exact sections you need. Explore more chart variations and premium design options in GoodPello's comprehensive graph slide collection.
Usage Points
-
Main Usage
This slide visualizes competitor analysis and market trend data using three distinct color groups for comparison. Multiple items within each color group can be displayed simultaneously, making complex data intuitive and easy to understand.
-
How to Use
Replace the title, subtitle, legend, group labels, and numerical values with your own data. Adjust bar heights manually or use PowerPoint's chart features for automatic updates. Insert this slide into the market analysis section of business plans or the competitive advantage section of investor presentations for maximum impact.
-
Recommended For
Ideal for business presentations where you need to explain market conditions to executives, investors, and partners. Marketing managers, strategy planners, sales teams, and anyone making data-driven decisions will find this slide valuable.
-
Slide Structure
Single-slide format featuring a column chart with three color-coded groups (blue, orange, green). Includes title and subtitle area at top, central graph area with color-grouped bars, bottom legend and category labels, and numerical values above each bar for easy reference.
Related Products
-

Bar Chart of Decline & Rise Analysis – Emphasizing Market Competitiveness
#Free Graphs
-

Competitive Advantage Bar General Graph – Emphasizing Performance through Market Analysis
#Free Graphs
-

Vertical Bar Chart for Data Analysis – Business Insights
#Free Graphs
-

Market Analysis by Year Horizontal Bar Graph
#Free Graphs
