Ringer Shape Subdivided Column Graph – Business Goals & Marketing Strategy
RM0100004_26
- Last Update 01/25/2025
- File Size 3.4MB
- # of Slides 2
- File Format PPTX
- Slide Ratio 16:9
- Color
Keywords
- #Content-Based Slides
- #Design-Based Slides
- #Business Vision and Strategy
- #Marketing Plan and Strategy
- #Diagram
- #Business Goals
- #Marketing Strategy
- #Cluster
- #Closed Cluster Diagram
- #16:9
- #column chart PowerPoint
- #4-section bar graph
- #marketing mix slide
- #data comparison chart
- #business strategy template
- #PowerPoint slide download
About the Product
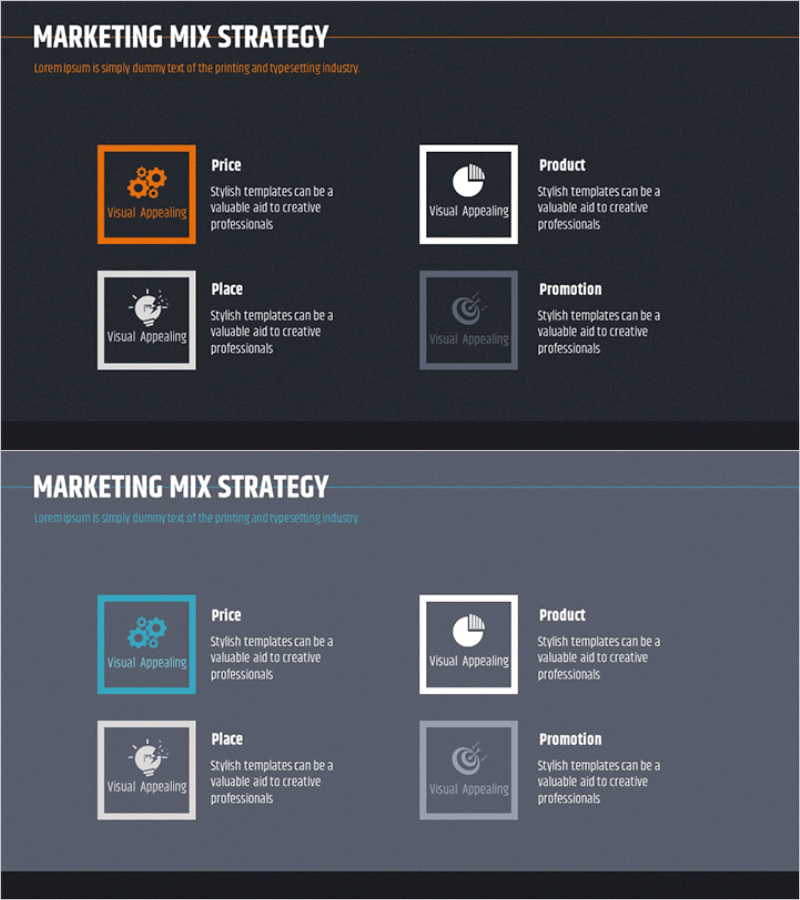
A PowerPoint slide featuring a 4-section column chart designed to visualize the marketing mix 4P strategy (Price, Product, Place, Promotion). Each section is color-coded for clear data comparison and analysis, with accompanying icons and text descriptions that enhance information clarity. The slide uses a dark background with orange, white, and gray accent colors, making it ideal for business presentations and strategic reports. This 16:9 widescreen format slide is ready for immediate editing and use in professional presentations.
Usage Points
-
Main Usage
Visualize and compare the marketing mix 4P elements (Price, Product, Place, Promotion) to clearly express the relative importance or investment allocation of each factor. Ideal for business strategy presentations, marketing planning meetings, and executive briefings.
-
How to Use
Input numerical values, percentages, or text into each column section to represent the proportion of marketing strategy elements. The color-coded sections intuitively convey each component's role, while icons and labels establish clear information hierarchy. Insert into presentation slides, planning documents, or reports to effectively communicate strategy analysis.
-
Recommended For
Marketing professionals, business planning teams, executive report coordinators, management consultants, and educators who need to present multi-element comparisons and strategic analysis. Particularly effective for business presentations requiring comparative visualization of multiple factors.
-
Slide Structure
Comprises 2 slides, each centered on a 4-section column chart. Icons (gear, hand pointer, globe, target symbol) and labels (Price, Product, Place, Promotion) are positioned on the left, with descriptive text aligned on the right. Dark background with orange, white, and gray accents creates visual hierarchy and professional appearance.
Related Products
-

Smart Healthcare Marketing Strategy Diagram
#Business Vision and Strategy #Marketing Plan and Strategy #Diagram
-

Marketing Strategy Radial Graph
#Business Vision and Strategy #Marketing Plan and Strategy #Diagram
-

Program Introduction Diagram – Clearly Conveying Business Goals
#Product/Service Introduction #Business Vision and Strategy #Diagram
-

Business Strategies Highlighting Growth - PowerPoint Template
#Business Vision and Strategy #Marketing Plan and Strategy #Diagram
