Development Status Radial Graph – Clarifying Business Vision and Goals
RJ0400050_24
- Last Update 05/31/2025
- File Size 0.1MB
- # of Slides 2
- File Format PPTX
- Slide Ratio 16:9
- Color
Keywords
- #Content-Based Slides
- #Design-Based Slides
- #Product/Service Introduction
- #Business Vision and Strategy
- #Diagram
- #Graph
- #Development Status
- #Business Goals
- #Cluster
- #Other
- #Closed Cluster Diagram
- #Radar Chart Spider Chart
- #16:9
- #radial graph PowerPoint
- #radar chart slide template
- #5-axis radial diagram
- #data visualization PowerPoint
- #multidimensional chart slide
About the Product
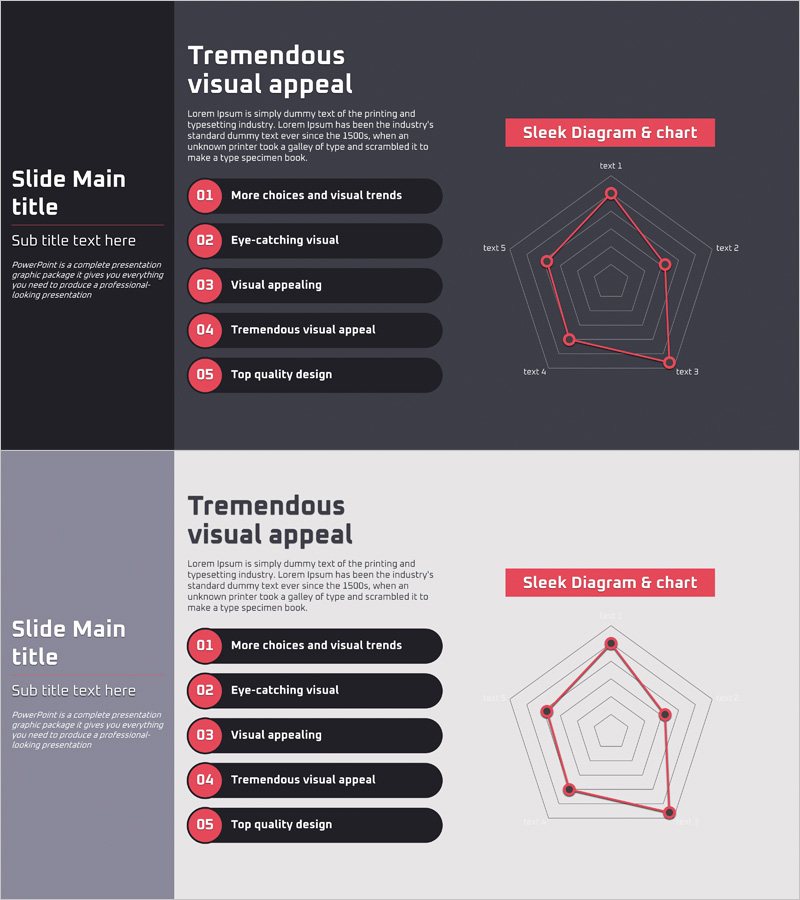
A PowerPoint slide template featuring a 5-axis radial chart (radar diagram) for visualizing multidimensional data. The design uses pink-red lines and nodes on dark and light background versions, making it ideal for comparing complex metrics such as business vision achievement, development status, organizational capabilities, and performance indicators. Each axis is clearly labeled with text fields, and the chart structure allows for easy data input and customization. Perfect for strategy presentations, performance analysis, and capability assessments in corporate settings.
Usage Points
-
Main Usage
Display and compare five different metrics or dimensions simultaneously using a radial (radar) chart format. Ideal for evaluating business vision achievement, project development progress, organizational capabilities, product characteristics, and performance metrics in a single visual representation.
-
How to Use
Enter metric names on each axis (text 1-5) and adjust node positions to reflect data values. Use the dark background version for executive presentations and formal boardroom settings, and the light background version for general meetings and training materials. Colors and line weights can be customized to match your presentation theme.
-
Recommended For
Executive teams presenting business vision and strategy, development teams reporting project status, HR departments conducting organizational capability assessments, marketing teams analyzing product positioning, and consultants presenting organizational diagnostics. Particularly effective for management reports and strategic planning meetings requiring multidimensional data comparison.
-
Slide Structure
Two-slide set. First slide features dark charcoal background with pink-red 5-axis radial chart; second slide uses light gray background with identical chart structure. Both slides include 'Sleek Diagram & Chart' badge in upper right, title and subtitle area on left, and centered 5-axis radar chart with labeled nodes and connecting lines.
Related Products
-

3-Axis Radar Chart Analysis – Effective Data Visualization
#Product/Service Introduction #Marketing Plan and Strategy #Diagram
-

Development Progress and Strategy - Intuitive Cluster Diagram
#Product/Service Introduction #Business Vision and Strategy #Diagram
-

Marketing Strategy Radial Graph
#Business Vision and Strategy #Marketing Plan and Strategy #Diagram
-

User Analysis Radial Graph – Understanding and Analyzing Customers
#Product/Service Introduction #Market and Competitor Analysis #Diagram
