Distribution Position Analysis Radial Graph – Visualizing Marketing Strategies
RM0400007_9
- Last Update 02/16/2025
- File Size 0.4MB
- # of Slides 2
- File Format PPTX
- Slide Ratio 16:9
- Color
Keywords
- #Content-Based Slides
- #Design-Based Slides
- #Marketing Plan and Strategy
- #Diagram
- #Graph
- #Positioning
- #Marketing Strategy
- #Cluster
- #Other
- #Closed Cluster Diagram
- #Radar Chart Spider Chart
- #16:9
- #radial chart PowerPoint
- #positioning analysis slide
- #5-axis radial diagram
- #competitive positioning template
- #marketing strategy chart PowerPoint
About the Product
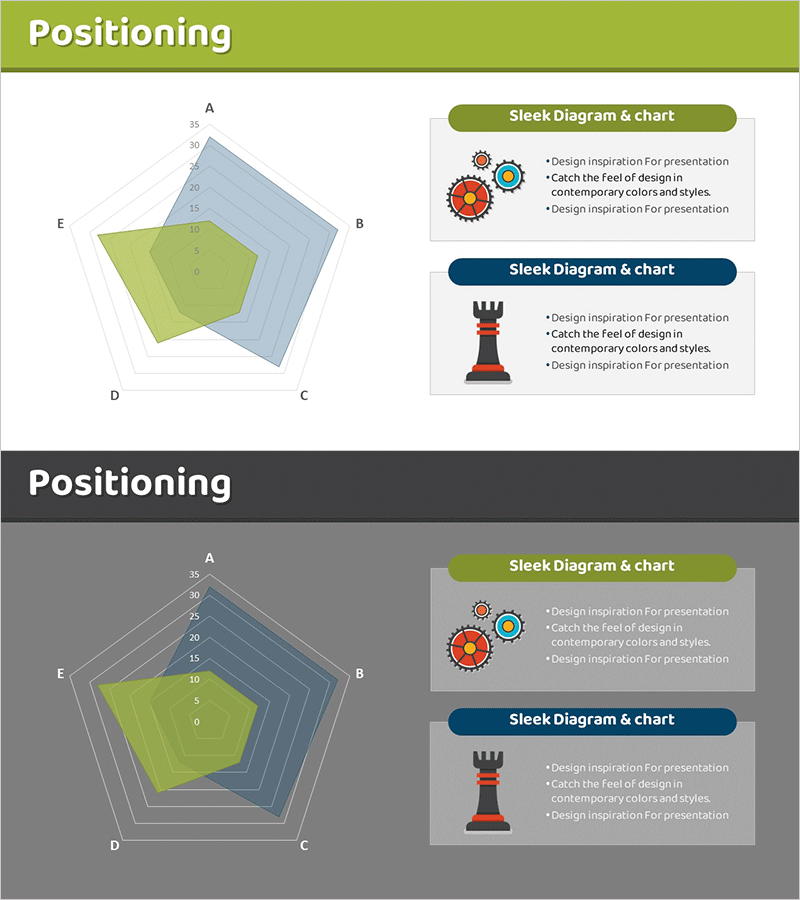
A 5-axis radial chart PowerPoint slide designed for marketing strategy and competitive positioning analysis. The multi-layered radial diagram combines lime green and blue tones to visually represent your company's strengths relative to competitors. This 2-slide set includes a standard radial graph and an icon-enhanced version featuring gear and chess symbols for strategic emphasis. Each axis is labeled A through E for clarity and easy data input. Perfect for presentations on market positioning, product feature comparison, and organizational capability assessment. Delivered as an editable 16:9 widescreen PPTX file.
Usage Points
-
Main Usage
Visualize your product or service's market positioning across five key dimensions (quality, price, technology, customer satisfaction, brand awareness, etc.) and compare against competitors. The radial structure instantly reveals strengths and weaknesses across all evaluation criteria.
-
How to Use
Slide 1 provides the base 5-axis radial graph—input your data values and add legend labels. Slide 2 includes gear and chess icons for emphasizing strategic and competitive concepts. Replace axis labels A–E with your evaluation categories and populate with corresponding data points.
-
Recommended For
Marketing managers, strategy planners, and product development teams presenting positioning analysis in executive reports, business plans, and proposals. Ideal for the competitive advantage section following SWOT analysis.
-
Slide Structure
2-slide set: Slide 1 features a lime-green-dominant 5-axis radial chart with multi-layered data series and blue gradient background. Slide 2 adds gear and chess icons in the upper right. Axes labeled A–B–C–D–E in clockwise order. 16:9 widescreen format.
Related Products
-

Marketing Strategy Radial Graph
#Business Vision and Strategy #Marketing Plan and Strategy #Diagram
-

Business Market Positioning Analysis – The Core of Marketing Strategy
#Marketing Plan and Strategy #Diagram #Graph
-

Direction for Enhancing Communication – Innovative Vision
#Business Vision and Strategy #Marketing Plan and Strategy #Diagram
-

Setting Strategic Marketing Service Goals – Service Strategy
#Technical Approach #Marketing Plan and Strategy #Diagram
