Visualizing Product Introduction with App Icon Graph – Innovation and Trends
RJ0400041_11
- Last Update 05/28/2025
- File Size 0.2MB
- # of Slides 2
- File Format PPTX
- Slide Ratio 16:9
- Color
Keywords
- #Content-Based Slides
- #Design-Based Slides
- #Product/Service Introduction
- #Business Introduction
- #Graph
- #Other
- #Development Status
- #Technological Status
- #16:9
- #app icon graph PowerPoint slide
- #product introduction presentation design
- #technology status visualization slide
- #app icon grid PPT template
- #product technology presentation slide
About the Product
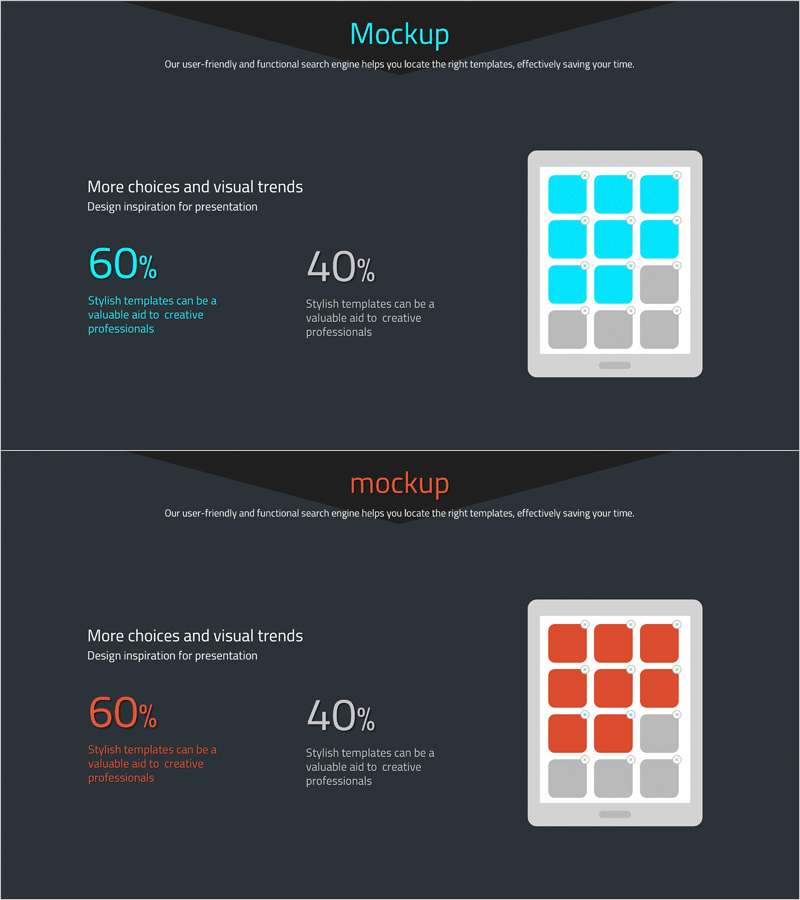
A PowerPoint slide that visualizes product and service technology status using an app icon graph design. Featuring a cyan blue background with white text areas and a colorful app icon grid arranged in a 2-slide composition, this template effectively communicates innovation and market trends. Provided in 16:9 widescreen PPTX format, it's ready for immediate use in the technology overview section of product introduction presentations. The left text area accommodates title and description, while the right icon grid displays service components, simultaneously expressing technological credibility and innovation.
Usage Points
-
Main Usage
Visualizes product and service technology status, innovative features, and service components through icon-based graphs to effectively communicate technological credibility and innovation to investors, partners, and customers.
-
How to Use
Enter title and description in the left text area, then arrange product core technologies or service components in the right icon grid. Add feature names to each icon cell for use in the technology overview section of product introduction presentations.
-
Recommended For
Ideal for product managers, technology leaders, and marketing professionals responsible for technology overview sections in product introduction decks, business presentations, and investment pitch materials.
-
Slide Structure
2-slide composition with each slide featuring a left text input area (1 title field, 1 description text field) and a right icon grid (3×3 or 2×3 structure). Cyan blue background with white text and colorful app icons creates clear information hierarchy and visual contrast.
Related Products
-

Medical Research Progress Diagram – Innovation and Development
#Product/Service Introduction #Business Introduction #Diagram
-

Infographic Slide for Performance Analysis – Clear Visualization
#Product/Service Introduction #Business Introduction #Graph
-

Musicians and Gauge Charts Slide – The Uniqueness of Data Visualization
#Product/Service Introduction #Business Introduction #Graph
-

Analysis of Social Media Cloud Development Status – Stylish Donut Chart
#Product/Service Introduction #Business Introduction #Graph
