Blue Green Horizontal Bar Graph – Optimized for Market and Competitive Analysis
RJ0700009_7
- Last Update 07/24/2025
- File Size 2.2MB
- # of Slides 2
- File Format PPTX
- Slide Ratio 16:9
- Color
Keywords
- #Content-Based Slides
- #Design-Based Slides
- #Market and Competitor Analysis
- #Diagram
- #Graph
- #Competitor Analysis
- #Market Analysis
- #Table
- #Horizontal Bar
- #Standard Table
- #Horizontal Bar Chart
- #16:9
- #horizontal bar chart PowerPoint
- #bar graph slide template
- #market analysis chart
- #competitive comparison graph
- #data comparison PPT slide
About the Product
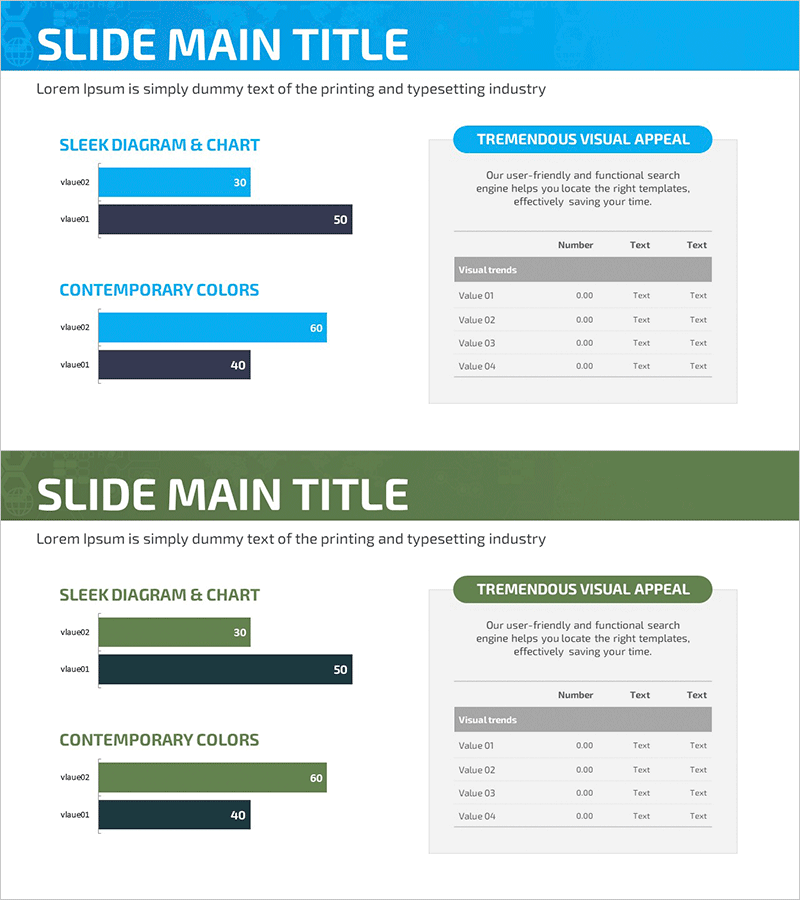
A horizontal bar chart PowerPoint slide optimized for market analysis and competitive comparison. The design uses contrasting blue and green color series to clearly represent comparative data, allowing viewers to intuitively compare numerical values across categories. The 2-slide set provides consistent layout templates, enabling multiple analysis topics to be presented in uniform format. This presentation slide is ready to use in reports and business presentations without additional design work.
Usage Points
-
Main Usage
Ideal for comparing two data series in market analysis, competitive benchmarking, performance comparisons, and strategic assessments. The contrasting blue and green colors emphasize numerical differences between items, while the horizontal layout maintains readability even with longer category labels.
-
How to Use
Replace bar lengths and numerical values with your own data. Both slides share identical layout, allowing sequential presentation of multiple analysis topics (market size, market share, growth rate, etc.). Colors and values can be easily modified using standard PowerPoint editing tools.
-
Recommended For
Recommended for data comparison sections in marketing plans, business reports, investor presentations, and strategy briefings. Suitable for market analysis, competitive benchmarking, departmental performance reviews, product line comparisons, and other business contexts requiring side-by-side data visualization.
-
Slide Structure
Both slides follow the same structure: title area at top, category labels on the left (visu#01, visu#02, etc.), and dual horizontal bars (blue and green series) on the right with numerical values displayed at bar ends. Upper right includes an information box (TREMENDOUS VISUAL APPEAL) and table area for supplementary data entry.
Related Products
-

Stylish Bar Chart Slide Design
#Market and Competitor Analysis #Diagram #Graph
-

Competitor and Customer Analysis Horizontal Bar Graph and Table
#Market and Competitor Analysis #Diagram #Graph
-

Sugar Content Analysis Bar Graph Table
#Market and Competitor Analysis #Diagram #Graph
-

Cement Theme Bar Graph & Table
#Market and Competitor Analysis #Diagram #Graph
