Competitor Comparison and Market Analysis Chart
RM0400014_10
- Last Update 02/18/2025
- File Size 2.2MB
- # of Slides 2
- File Format PPTX
- Slide Ratio 16:9
- Color
Keywords
- #Content-Based Slides
- #Design-Based Slides
- #Market and Competitor Analysis
- #Graph
- #Competitor Analysis
- #Market Analysis
- #Horizontal Bar
- #Horizontal Bar Chart
- #16:9
- #competitor comparison chart
- #market analysis PowerPoint
- #horizontal bar graph slide
- #competitive analysis template
- #business data visualization slide
About the Product
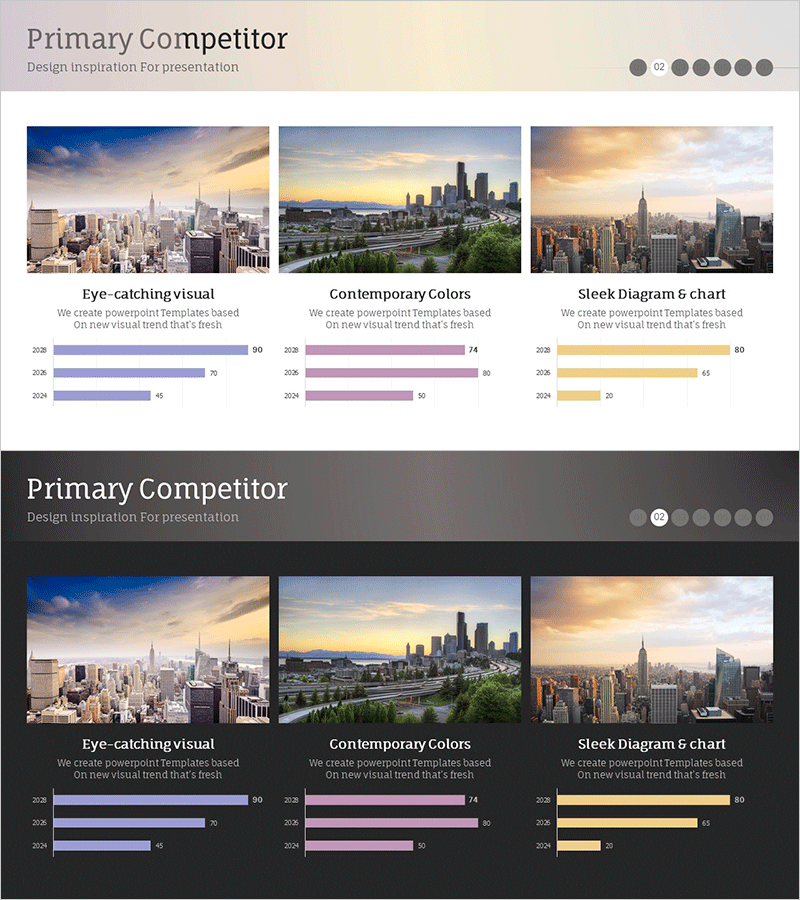
A horizontal bar chart PowerPoint slide designed for competitive analysis and market trend visualization. This presentation template displays year-over-year comparison of three data series with distinct color coding in blue, purple, and yellow tones for clear differentiation. The 2-slide set includes both light beige and dark gray background layouts, allowing you to match your overall presentation theme. Paired with cityscape imagery, this slide deck enhances business credibility and is fully editable in PPTX format for immediate customization.
Usage Points
-
Main Usage
Ideal for comparing competitor performance metrics, analyzing market share, and visualizing year-over-year trends. The horizontal bar format enables simultaneous comparison of multiple data points, supporting strategic decision-making during planning phases.
-
How to Use
Use in executive reports, investor presentations, and strategic planning meetings within the competitive landscape analysis section. Data values are directly editable with automatic bar length adjustment, enabling real-time updates and quick modifications.
-
Recommended For
Marketing managers, business planning teams, executive report coordinators, management consultants, and investor relations (IR) professionals preparing competitive analysis materials.
-
Slide Structure
2-slide set with Slide 1 featuring light beige background and Slide 2 with dark gray background. Each slide contains three data series (blue, purple, yellow) with three horizontal bars per series, representing nine total data points. Year labels (2022, 2023, 2024) and numerical values are included for reference.
Related Products
-

Stylish Bar Chart Slide Design
#Market and Competitor Analysis #Diagram #Graph
-

Competitor Growth Comparison Chart – Essential Slide for Market Analysis
#Market and Competitor Analysis #Graph #Competitor Analysis
-

Competitor and Market Analysis Slide – Pink & Bluegreen PowerPoint Template
#Market and Competitor Analysis #Graph #Competitor Analysis
-

Data Analysis Bar Graph – Essential for Market and Competitor Analysis
#Market and Competitor Analysis #Graph #Competitor Analysis
