Competitive Hotel Service Comparison Analysis Diagram
RM0400013_10
- Last Update 02/18/2025
- File Size 0.7MB
- # of Slides 2
- File Format PPTX
- Slide Ratio 16:9
- Color
Keywords
- #Content-Based Slides
- #Design-Based Slides
- #Market and Competitor Analysis
- #Graph
- #Competitor Analysis
- #Market Analysis
- #Horizontal Bar
- #Horizontal Bar Chart
- #16:9
- #hotel competitive analysis PowerPoint
- #competitive comparison diagram slide
- #horizontal bar chart template
- #hotel service comparison PPT
- #competitive positioning presentation slide
About the Product
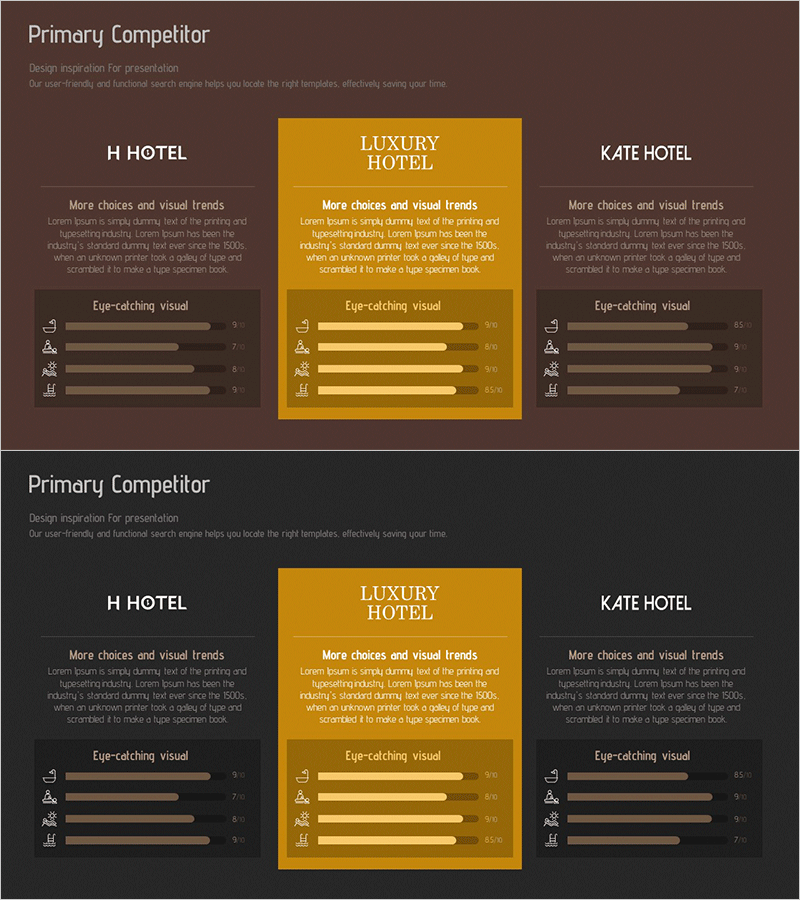
A PowerPoint slide template for visually comparing and analyzing competitive hotel services across three brands. The design features H HOTEL, LUXURY HOTEL, and KATE HOTEL positioned side-by-side, with each brand evaluated across four service metrics using horizontal bar graphs. The layout uses a brown background with a gold-highlighted center box to emphasize the focal hotel brand. This presentation slide is ready to use in market analysis reports, competitive positioning documents, and strategic planning presentations for the hospitality industry.
Usage Points
-
Main Usage
Used in the hospitality and tourism industry to quantitatively compare competitor service levels and clearly communicate your hotel's competitive position. Essential for executive briefings, marketing strategy development, and investor presentations to visualize market positioning.
-
How to Use
Enter the three competitor hotel names and evaluation metric labels, then adjust the bar lengths to reflect your comparison data. Position the key hotel in the center gold box for maximum emphasis. During presentation, explain differentiation points against left and right competitors while referencing the visual metrics.
-
Recommended For
Hotel and resort executives, tourism marketing managers, real estate development strategists, management consulting analysts, and investment firm reviewers preparing competitive analysis materials. Ideal for market research reports, business plans, and strategic management presentations.
-
Slide Structure
Two-slide layout. Title area at top, three hotel cards arranged horizontally (left brown, center gold, right brown). Each card contains four horizontal bar graphs representing service evaluation metrics on a 0-10 scale. Bar colors correspond to each hotel's theme color, with numerical labels displayed on the right side of each bar.
Related Products
-

Gradient Bar Graph Presentation – Market Competitiveness Analysis
#Market and Competitor Analysis #Graph #Competitor Analysis
-

Sugar Content Analysis Bar Graph Table
#Market and Competitor Analysis #Diagram #Graph
-

Competitor Comparison and Market Analysis Chart
#Market and Competitor Analysis #Graph #Competitor Analysis
-

Securities Service Analysis Graph – Competitor Analysis
#Market and Competitor Analysis #Graph #Competitor Analysis
