Business Idea Analysis Bar Graph – Visualizing Market Competitiveness
RJ0300076_20
- Last Update 05/10/2025
- File Size 0.5MB
- # of Slides 2
- File Format PPTX
- Slide Ratio 16:9
- Color
Keywords
- #Content-Based Slides
- #Design-Based Slides
- #Product/Service Introduction
- #Market and Competitor Analysis
- #Diagram
- #Graph
- #Development Status
- #Market Analysis
- #Cluster
- #Column
- #Closed Cluster Diagram
- #16:9
- #bar chart PowerPoint slide
- #vertical bar graph
- #data comparison chart
- #business analysis slide
- #market competitiveness visualization
- #year-over-year trend chart
About the Product
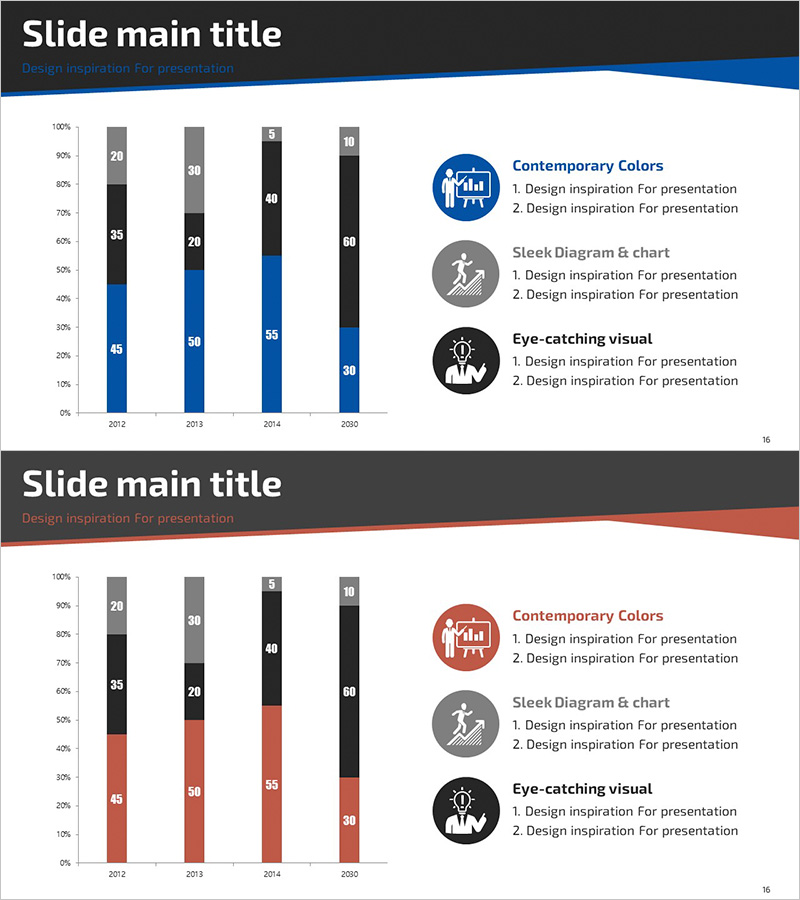
A vertical bar chart PowerPoint slide that visualizes business ideas and market competitiveness across four years (2012–2020). The slide presents data in three distinct color series (blue, black, and gray) to enable clear year-over-year and multi-series comparison. Each data point is labeled with numerical values, and a legend with circular icons provides quick reference. The 16:9 PPTX format with 2-slide layout is ready for immediate use in business presentations, reports, and competitive analysis decks. Fully editable to accommodate your own datasets and labels.
Usage Points
-
Main Usage
Designed to present quantitative data comparisons and trend analysis in a clear, professional manner. Ideal for visualizing business performance metrics, market share trends, sales growth, customer satisfaction changes, and competitive positioning across multiple time periods.
-
How to Use
Insert this slide into the analysis or results section of your presentation where numerical comparison is required. Customize the legend labels and colors to match your data categories, then update the bar heights and values. The right-side legend area can accommodate additional insights or explanatory text.
-
Recommended For
Executive reports, business plans, marketing proposals, investor pitch decks, quarterly and annual performance reviews, market research reports, and competitive analysis documents. Ideal for strategists, business analysts, sales managers, financial officers, and data-driven decision makers.
-
Slide Structure
Two-slide set with identical bar chart structure but different accent colors (blue series on slide 1, red series on slide 2). Each slide features 4 vertical bars per year (12 bars total across 3 series) on the left, with a 3-icon legend and descriptive text on the right in a balanced 2-column layout.
Related Products
-

Bar Graph of Progress Analysis by Task - Effective Visualization of Progress
#Product/Service Introduction #Market and Competitor Analysis #Marketing Plan and Strategy
-

Current Trends and Issues Analysis Chart – Market and Competitor Analysis
#Market and Competitor Analysis #Diagram #Graph
-

Current Status Analysis Pie Chart – Insights for Market Analysis
#Product/Service Introduction #Market and Competitor Analysis #Diagram
-

Experimental Results Analysis Vertical Bar Graph – Incorporating Visual Trends
#Market and Competitor Analysis #Diagram #Graph
