Curved Gradient Line Graph – Market and Competitor Analysis
RJ0400054_10
- Last Update 06/01/2025
- File Size 1MB
- # of Slides 2
- File Format PPTX
- Slide Ratio 16:9
- Color
Keywords
About the Product
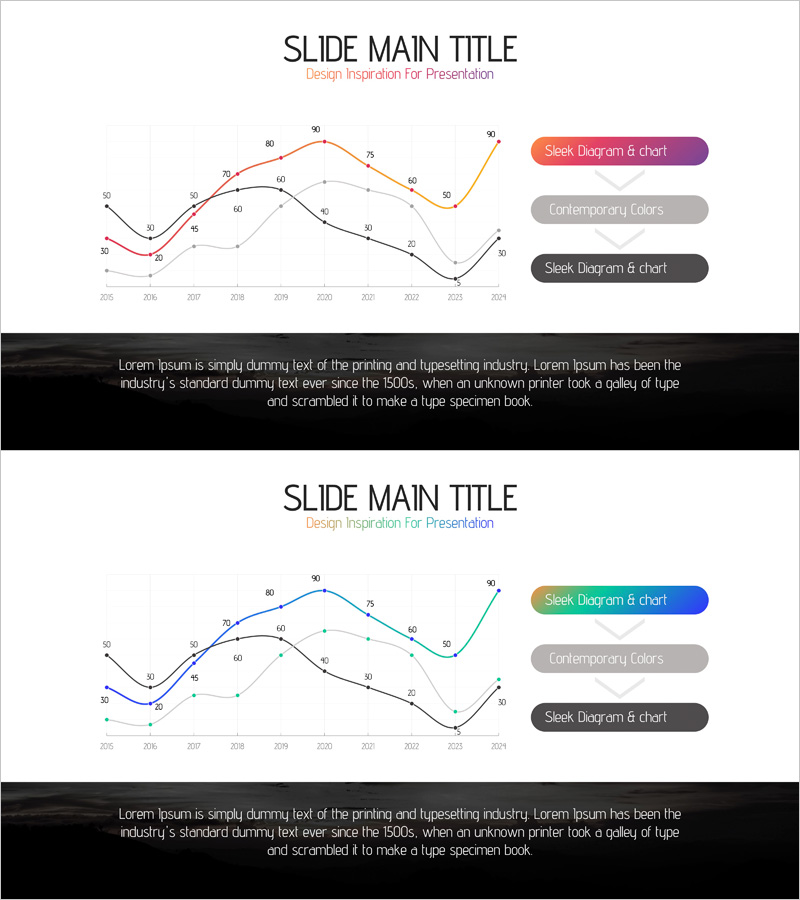
A multi-series line graph PowerPoint slide optimized for market analysis and competitive benchmarking. This presentation template displays data trends from 2015 to 2024 using three distinct line series in orange, black, and gray, enabling immediate visual comparison of market performance, competitor metrics, and business KPIs. Each data point is marked with a clear indicator, and the legend uses gradient styling for enhanced visual hierarchy. The 16:9 widescreen format across 2 slides integrates seamlessly into business reports, strategic presentations, and quarterly performance reviews. Fully editable data values and axis labels allow quick customization for your specific analysis needs.
Usage Points
-
Main Usage
Visualize and compare multiple data series over time to identify market trends, competitive positioning, and performance trajectories. This slide enables stakeholders to assess how your organization and competitors have evolved across key metrics, supporting data-driven decision-making and strategic planning.
-
How to Use
Insert this slide into business plans, marketing strategy decks, or quarterly performance reports to illustrate market dynamics and competitive landscape. Click on any line series or data point to edit values, modify axis labels, and update the legend to reflect your specific metrics such as market share, revenue growth, or customer satisfaction scores.
-
Recommended For
Strategy teams, marketing departments, sales executives, and business analysts preparing competitive analysis, market research presentations, and executive briefings. Particularly effective when presenting benchmark data, market positioning, or multi-year performance trends to C-suite and board audiences.
-
Slide Structure
Two-slide deck featuring identical 3-series line charts with orange, black, and gray lines representing different data categories. X-axis spans 2015–2024 (10-year timeline), Y-axis ranges from 0–90 with gridlines for readability. Data points are marked with circular indicators, and the legend is positioned in the upper right corner with gradient-styled labels for visual distinction.
Related Products
-

Desperate Stock Price Decline Graph – The Tragedy of Market Analysis
#Market and Competitor Analysis #Graph #Competitor Analysis
-

Competition Graphs and Analysis – Slides for Market Advantage
#Market and Competitor Analysis #Graph #Competitor Analysis
-

Market Insights Through Competition Analysis Chart – Gaining Competitive Edge
#Market and Competitor Analysis #Graph #Competitor Analysis
-

Visualizing Market Analysis with Line Chart – Harmony of Mint and Orange
#Market and Competitor Analysis #Diagram #Graph
