Space Illustration Theme Circle Graph
RJ0700022_13
- Last Update 07/28/2025
- File Size 0.3MB
- # of Slides 2
- File Format PPTX
- Slide Ratio 16:9
- Color
Keywords
About the Product
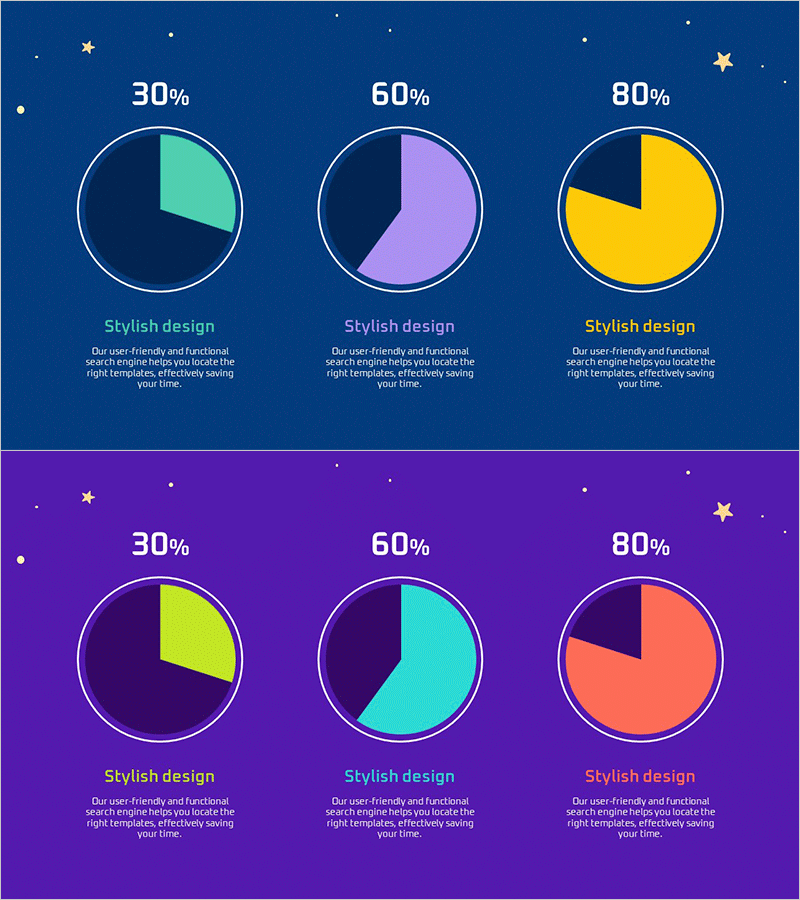
A pie chart PowerPoint slide set featuring a space illustration background. This presentation template includes three circle graphs displaying 30%, 60%, and 80% data ratios, each distinguished by mint, lavender, and yellow colors. The dark blue background with stars and celestial decorations adds a cosmic dimension to your presentation. Optimized for ratio-based information delivery such as market analysis, competitive analysis, and data visualization, this 16:9 PPTX template with 2 slides is ready for immediate editing and use.
Usage Points
-
Main Usage
This pie chart slide clearly visualizes ratio-based data at a glance. Perfect for presenting market share, customer composition, budget allocation, and competitive comparisons to show the relationship between parts and the whole. The space-themed colors and background provide distinctive visual impact to your presentation.
-
How to Use
Edit the percentage values and colors of each pie chart to match your data. Keep the dark blue background and star decorations while adding your own legends, titles, and descriptive text. Apply to investor presentations, executive reports, marketing strategy meetings, and various business scenarios.
-
Recommended For
Recommended for marketing managers, data analysts, executives, consultants, and sales leaders who need to persuade decisions based on quantitative data. Particularly effective for market analysis, customer segmentation, financial reporting, and business performance analysis sections.
-
Slide Structure
Composed of 2 slides, each featuring 3 pie charts (30%, 60%, 80% ratios) arranged horizontally. Percentage values appear at the top, with 'Stylish design' text and description area at the bottom. Mint, lavender, and yellow colors distinguish each chart's data segments. The 16:9 widescreen format is optimized for modern projectors and digital displays.
Related Products
-

Purchase Volume Comparison Analysis Circle Graph – Understanding Market Share
#Product/Service Introduction #Market and Competitor Analysis #Graph
-

Market Share Analysis Graph & Table – Enhancing Understanding through Data Visualization
#Product/Service Introduction #Market and Competitor Analysis #Diagram
-

Modern Theme Pie Chart – Market Share Analysis
#Product/Service Introduction #Market and Competitor Analysis #Graph
-

Securities Business Analysis Circle Graph
#Product/Service Introduction #Market and Competitor Analysis #Graph
