Pie Chart about War – Visualizing Information
RJ0600056_21
- Last Update 07/05/2025
- File Size 2.8MB
- # of Slides 2
- File Format PPTX
- Slide Ratio 16:9
- Color
Keywords
About the Product
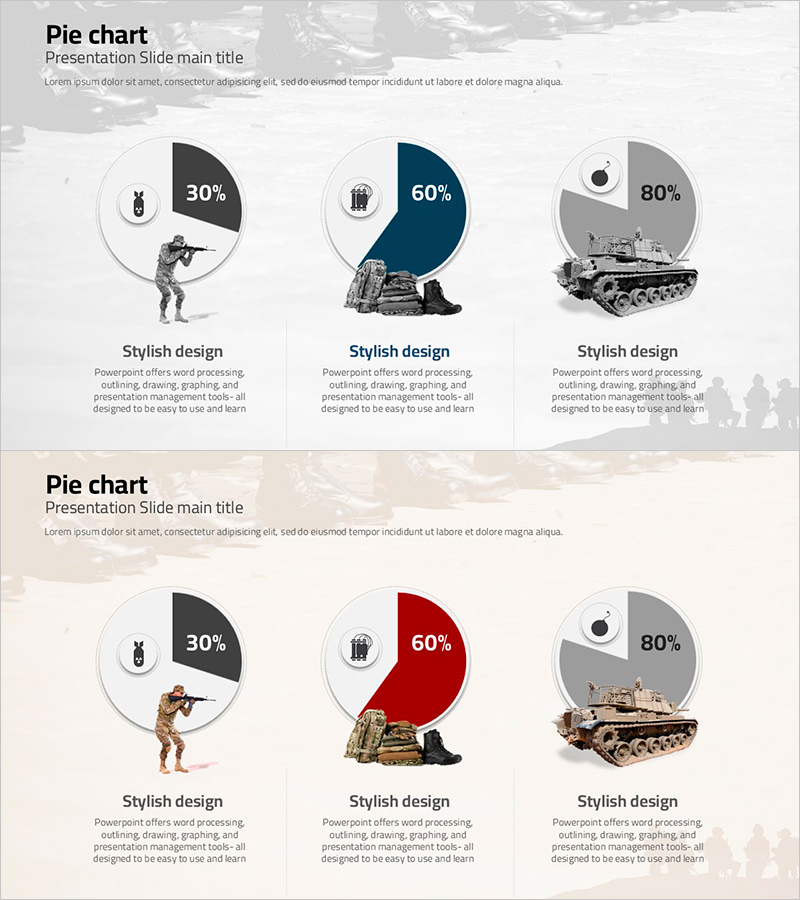
A PowerPoint pie chart slide that visualizes data in three segments with clear ratio representation. The slide features black, navy blue, and gray pie segments displaying 30%, 60%, and 80% proportions, complemented by silhouette imagery and descriptive text below each section. This 2-slide presentation template enables immediate use for comparative data analysis and information visualization in business presentations.
Usage Points
-
Main Usage
This pie chart slide is designed to display data composition and relative proportions at a glance. It effectively represents market share, competitive analysis, product sales distribution, and customer demographics through proportional visualization, while silhouette imagery beneath each segment provides intuitive categorical meaning.
-
How to Use
Use this slide in market analysis, product introduction, and business status sections of presentations to represent ratio-based data. Edit the percentage values and text areas under each pie segment to input actual data, and customize colors and images as needed to align with your brand identity.
-
Recommended For
Marketing professionals, sales teams, executives preparing reports, consultants, and educators benefit from this template for data-driven presentations. It is particularly suitable for competitive analysis, market overview, product positioning, and customer segmentation discussions.
-
Slide Structure
The 2-slide template features three pie charts per slide. Each pie chart is segmented into black (30%), navy blue (60%), and gray (80%) sections, with silhouette imagery and descriptive text areas positioned below each segment, allowing simultaneous presentation of data and explanatory content.
Related Products
-

Modern Theme Pie Chart – Market Share Analysis
#Product/Service Introduction #Market and Competitor Analysis #Graph
-

Construction Development Status Chart – Key to Construction Market Analysis
#Product/Service Introduction #Market and Competitor Analysis #Graph
-

4 Donut Charts for Data Visualization – Easy Presentation Template
#Product/Service Introduction #Market and Competitor Analysis #Graph
-

Internet Shopping Market Analysis Chart
#Product/Service Introduction #Market and Competitor Analysis #Diagram
