Market Share Circle Pie Chart
RJ0300051_14
- Last Update 05/02/2025
- File Size 3.1MB
- # of Slides 2
- File Format PPTX
- Slide Ratio 16:9
- Color
Keywords
- #Content-Based Slides
- #Design-Based Slides
- #Product/Service Introduction
- #Market and Competitor Analysis
- #Graph
- #Development Status
- #Market Share
- #Circles
- #Pie Chart
- #16:9
- #pie chart PowerPoint slide
- #circular graph template
- #market share analysis
- #3-segment ratio chart
- #business data visualization slide
About the Product
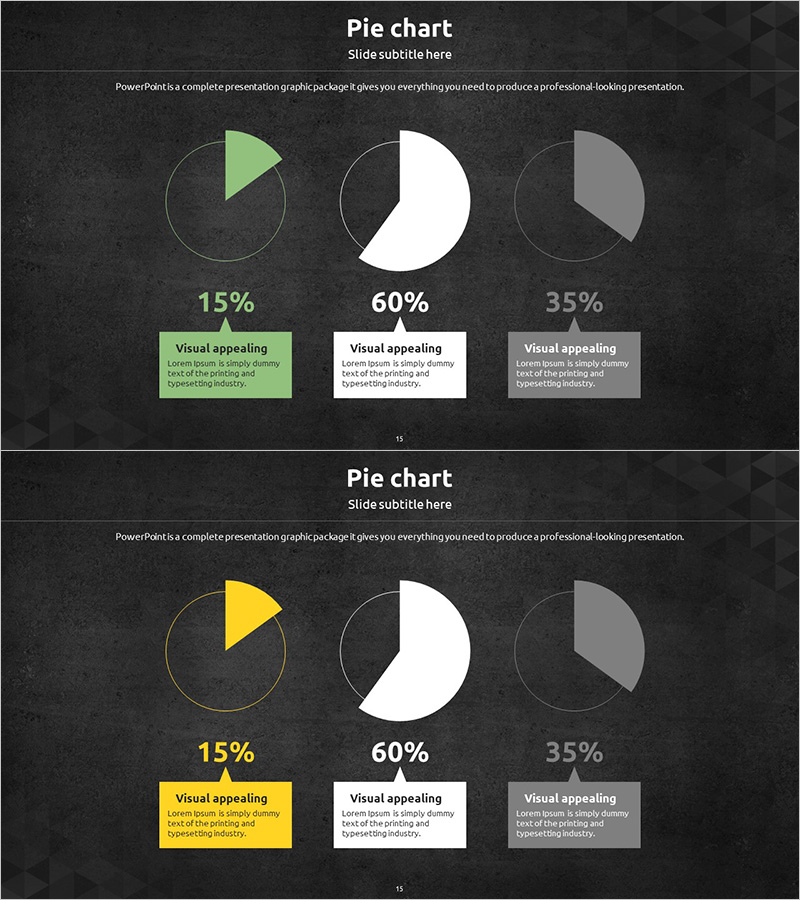
A professional pie chart PowerPoint slide optimized for market share and competitive analysis presentations. Features two layout variations with three-segment pie charts displayed against a dark background, using green, white, and gray color differentiation. Each chart segment includes percentage values and descriptive text boxes for clear data communication. The slide deck is provided in 16:9 widescreen PPTX format, fully editable and ready for immediate use. Ideal for visualizing market distribution, revenue composition, customer segmentation, and other ratio-based business metrics in executive presentations.
Usage Points
-
Main Usage
Compares three-way ratio data such as market share, revenue breakdown, or customer segments. The color-coded pie chart segments enable audiences to quickly grasp proportional relationships and competitive positioning without detailed explanation.
-
How to Use
Simply replace the percentage values and descriptive text with your own data. The dark background ensures visibility on projection screens, and you can choose between the two provided layouts based on your presentation needs.
-
Recommended For
Executive reports, business plans, marketing presentations, investor pitches, quarterly earnings calls, and competitive analysis meetings. Suitable for finance, retail, manufacturing, technology, and other industries requiring data-driven market insights.
-
Slide Structure
2-slide deck. Each slide contains three pie charts arranged horizontally with green (15%), white (60%), and gray (35%) segment emphasis. Percentage labels and explanation text boxes are positioned below each chart for comprehensive data annotation.
Related Products
-

4 Donut Charts for Data Visualization – Easy Presentation Template
#Product/Service Introduction #Market and Competitor Analysis #Graph
-

Pie Chart of the Development Status of the Snow Mountain Theme
#Product/Service Introduction #Market and Competitor Analysis #Diagram
-

Pie Chart for Learning Progress – Optimizing Data Visualization
#Product/Service Introduction #Market and Competitor Analysis #Graph
-

Purchase Volume Comparison Analysis Circle Graph – Understanding Market Share
#Product/Service Introduction #Market and Competitor Analysis #Graph
