Visualizing Projected Income, Expenses, and Key Metrics by Business
RM0100020_15
- Last Update 06/28/2025
- File Size 16.8MB
- # of Slides 2
- File Format PPTX
- Slide Ratio 16:9
- Color
Keywords
- #Content-Based Slides
- #Design-Based Slides
- #Financial Plans and Performance
- #Diagram
- #Text Box
- #Income Statement
- #Sales and Revenue
- #Table
- #Standard Table
- #Rectangle Text Box
- #16:9
- #financial income statement table PowerPoint
- #business division income comparison slide
- #profit and loss statement template
- #financial performance comparison PPT
- #revenue expense analysis slide
About the Product
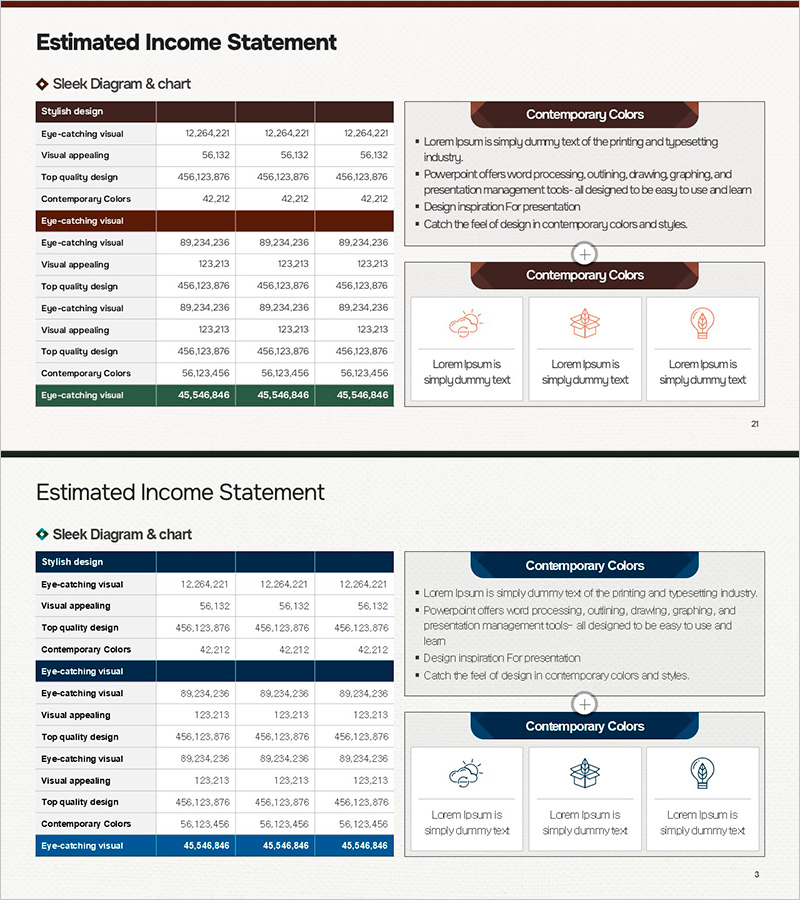
A table-based PowerPoint slide for comparing projected income, expenses, and key metrics across three business divisions at a glance. The horizontal table structure clearly visualizes financial performance by organizing revenue, costs, and performance indicators for each business unit. The high-contrast design features a two-tone background in brown and navy with white text, ensuring excellent readability during presentations. Each cell is editable for direct data entry, making it immediately applicable to financial reports, business performance presentations, investor briefings, and other professional business contexts.
Usage Points
-
Main Usage
Optimized for quantitatively comparing financial performance across business divisions and simultaneously presenting income status and key performance indicators. Structures multiple data points such as projected income, actual income, and target achievement rates to clearly present decision-making evidence.
-
How to Use
Directly input business division names and revenue, expense, and metric figures into cells for immediate use. Apply in financial report performance analysis sections, quarterly or annual business performance presentations, executive briefings, investor presentations, and shareholder meetings to objectively communicate financial status.
-
Recommended For
Recommended for CFOs, finance managers, business unit heads, and executives presenting financial performance to investors, shareholders, and boards of directors. Also suitable for business planning stages when comparing projected income or during performance evaluation meetings to analyze actual results.
-
Slide Structure
Two-slide composition: the first slide features a brown header row with three business division columns in a horizontal table format, and the second slide uses a navy header row with the same three-column structure. Each cell is designed as an editable text box for data entry, with rows organized by income statement items (revenue, expenses, profit) and key performance metrics.
Related Products
-

Fantastic Wide PPT Table – Detailed Financial Planning & Performance
#Financial Plans and Performance #Diagram #Income Statement
-

Sales and Profit Calculation Table – Efficient Profit Management
#Financial Plans and Performance #Diagram #Income Statement
-

Bank Income Statement – Visualizing Financial Performance
#Financial Plans and Performance #Diagram #Income Statement
-

Business Income Statement Slide - Highlighting Financial Performance
#Financial Plans and Performance #Diagram #Income Statement
