Pencil Bar Chart for Market Analysis – Visual Competitiveness
RB0300032_5
- Last Update 03/10/2025
- File Size 2.4MB
- # of Slides 2
- File Format PPTX
- Slide Ratio 4:3
- Color
Keywords
- #Content-Based Slides
- #Design-Based Slides
- #Market and Competitor Analysis
- #Graph
- #Other
- #Competitor Analysis
- #Market Analysis
- #Horizontal Bar
- #Horizontal Bar Chart
- #4:3
- #horizontal bar chart PowerPoint
- #market analysis slide template
- #competitive comparison chart
- #bar graph PPT template
- #data comparison slide design
About the Product
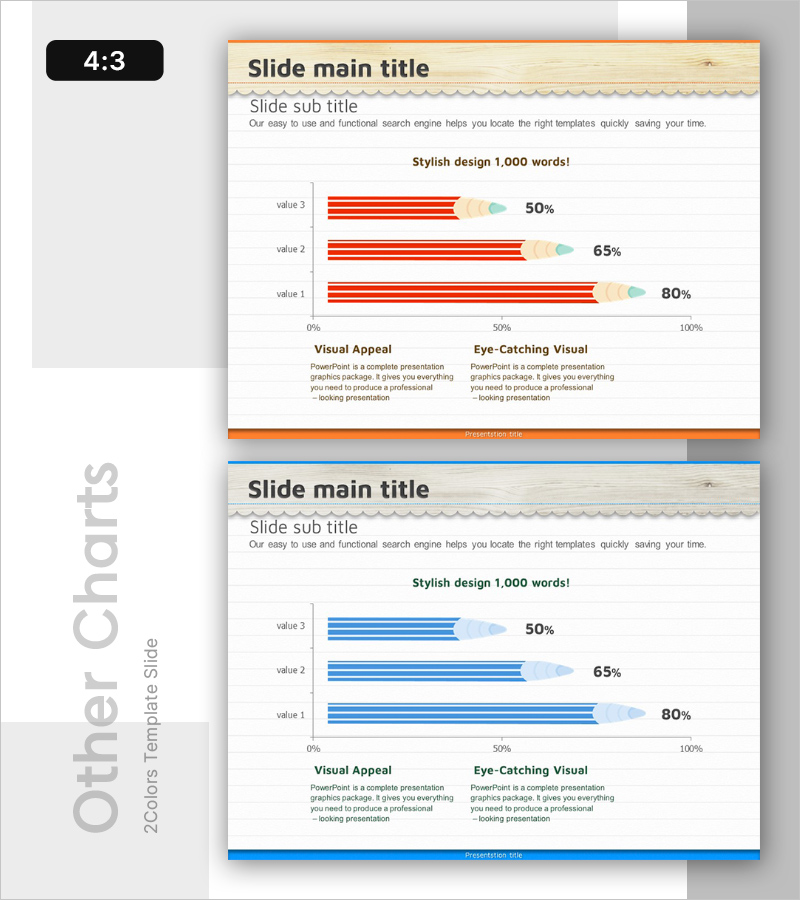
A horizontal bar chart PowerPoint slide optimized for market analysis and competitive comparison. Features three data items with distinctive pencil-shaped arrow endpoints in orange and blue color versions. Each bar displays percentage values from 0 to 100%, with item labels on the left (value 1, 2, 3) and percentage figures on the right. The wood-textured background and dotted decorative borders create visual cohesion across presentation slides. Delivered as 2 fully editable slides in 4:3 aspect ratio.
Usage Points
-
Main Usage
Compares three data points such as market size, market share, or competitor performance using horizontal bars. The distinctive pencil-shaped arrow design adds visual interest to presentations while effectively displaying percentage-based data comparisons.
-
How to Use
Insert into business plans, marketing strategy presentations, or quarterly reports in the market analysis section. Edit bar lengths and percentages with actual data, then select either the orange or blue version to match your presentation's color scheme and tone.
-
Recommended For
Marketing professionals, strategy planners, and sales managers presenting market conditions, competitive analysis, and performance comparisons. Ideal for executive briefings, investor presentations, and strategic planning meetings requiring data-driven decision-making.
-
Slide Structure
2-slide set: orange version (3 horizontal bars with 50%, 65%, 80% values) and blue version (identical layout). Each slide contains title and subtitle areas, central graph section with 3 bars, percentage labels, 0–100% axis, and descriptive text area at bottom.
Related Products
-

Donut Circle Graph & Cube Graph – Optimized for Market & Competitor Analysis
#Market and Competitor Analysis #Graph #Other
-

Two Types of Area Graphs – Market and Competitor Analysis
#Market and Competitor Analysis #Graph #Other
-

Spaceship Launch Analysis Graph – Ideal for Competitor Analysis
#Market and Competitor Analysis #Diagram #Graph
-

Comparative Analysis Vertical Bar Graph for Market Insights
#Market and Competitor Analysis #Graph #Other
