Interest Type Analysis for Children – Market and Competitor Analysis
RB0300035_5
- Last Update 03/11/2025
- File Size 0.4MB
- # of Slides 2
- File Format PPTX
- Slide Ratio 4:3
- Color
Keywords
- #Content-Based Slides
- #Design-Based Slides
- #Market and Competitor Analysis
- #Graph
- #Competitor Analysis
- #Market Analysis
- #Horizontal Bar
- #Horizontal Bar Chart
- #4:3
- #horizontal bar chart PowerPoint
- #bar graph presentation slide
- #data comparison chart template
- #4-item analysis slide
- #market analysis graph PowerPoint
About the Product
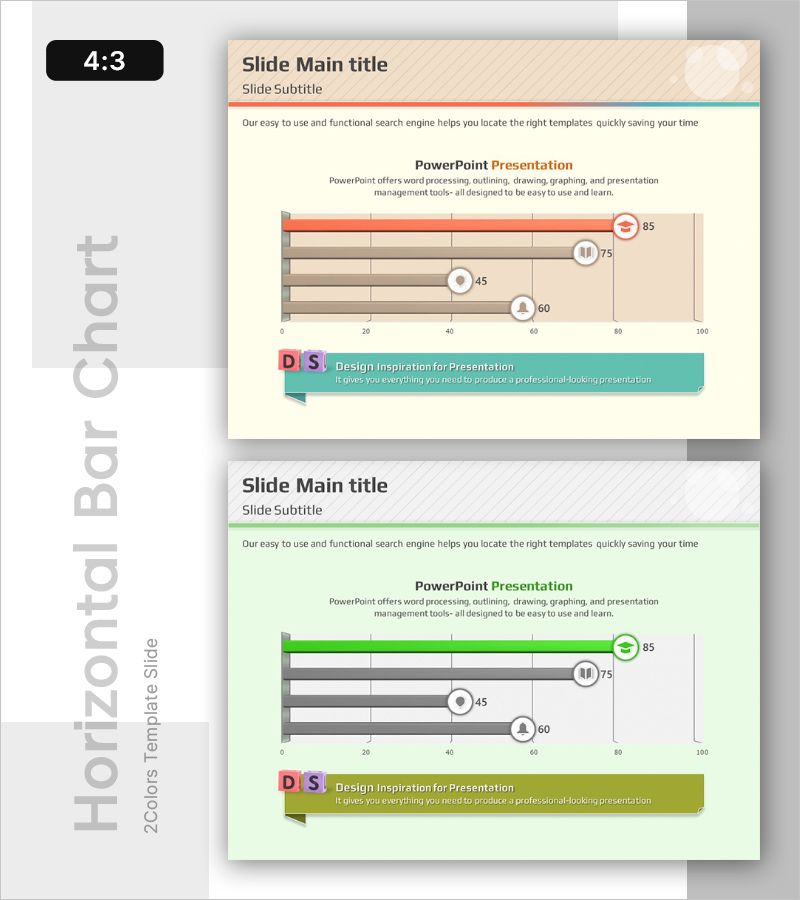
A horizontal bar chart PowerPoint slide designed for children's interest type analysis and market comparison. This data visualization template features a beige background with four items displayed in orange, gray, and green tones, each with numerical values (85, 75, 45, 60) highlighted by circular icons. The slide effectively presents quantitative data for competitive analysis, customer preference surveys, and product performance comparisons in business presentations. The 2-slide set is ready to use immediately, with fully editable colors and data values for customization.
Usage Points
-
Main Usage
This horizontal bar chart slide visualizes quantitative data across four items for side-by-side comparison. It effectively displays children's interest types, market share, customer satisfaction, or product performance metrics, allowing audiences to instantly grasp relative values and rankings.
-
How to Use
Use this slide in business plans, marketing proposals, and market analysis reports when presenting data sections such as competitor comparisons, customer preference studies, or product performance evaluations. Simply replace the circular icons and numerical values with your own data and insert directly into your presentation.
-
Recommended For
Marketing professionals, business analysts, strategists, and sales teams presenting customer analysis, market research, and competitive findings. Ideal for children's product companies, educational institutions, and research firms delivering data-driven presentations.
-
Slide Structure
2-slide set. The first slide features a beige background with four horizontal bars (orange, gray, gray, beige) representing four items, each with a circular icon and value (85, 75, 45, 60) at the end. The second slide presents the same structure with a green background variation.
Related Products
-

Gradient Bar Graph Presentation – Market Competitiveness Analysis
#Market and Competitor Analysis #Graph #Competitor Analysis
-

Stylish Bar Chart Slide Design
#Market and Competitor Analysis #Diagram #Graph
-

Competitor and Market Analysis Slide – Pink & Bluegreen PowerPoint Template
#Market and Competitor Analysis #Graph #Competitor Analysis
-

Data Analysis Bar Graph – Essential for Market and Competitor Analysis
#Market and Competitor Analysis #Graph #Competitor Analysis
