Business Investment Market Analysis Donut Graph
RJ0300096_14
- Last Update 05/16/2025
- File Size 0.3MB
- # of Slides 2
- File Format PPTX
- Slide Ratio 16:9
- Color
Keywords
- #Content-Based Slides
- #Design-Based Slides
- #Product/Service Introduction
- #Market and Competitor Analysis
- #Diagram
- #Graph
- #Development Status
- #Market Analysis
- #Table
- #Circles
- #Doughnut Chart
- #16:9
- #donut chart PowerPoint slide
- #pie chart template
- #ratio visualization presentation
- #circular graph slide
- #market analysis PowerPoint
- #donut graph download
About the Product
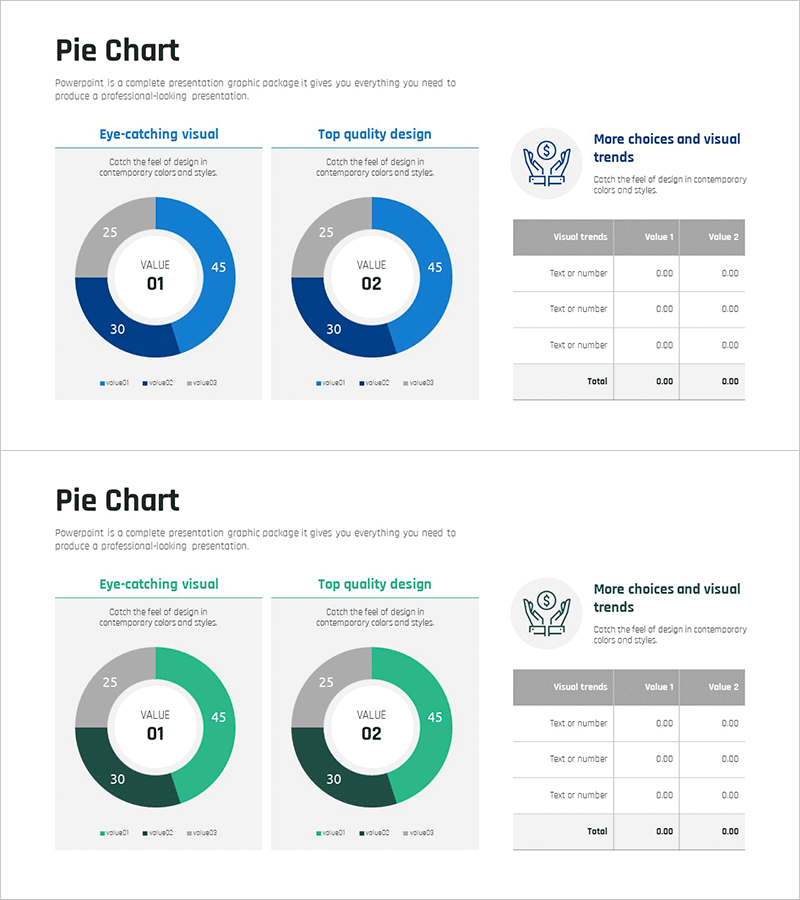
A professional donut chart PowerPoint slide set featuring 2 slides optimized for business investment and market analysis presentations. Each slide displays a three-segment donut graph with a central value indicator and outer ring divided into three proportional sections, available in blue and green color schemes. The 16:9 widescreen PPTX format is fully editable and ideal for visualizing financial ratios, market share, budget allocation, and customer composition data. An accompanying data table on each slide enables quick numerical input and automatic chart updates, making it perfect for investment returns, revenue distribution, and market segmentation presentations.
Usage Points
-
Main Usage
Visualizes compositional ratios such as investment returns, market share, budget allocation, and customer demographics. The central value area emphasizes key metrics while the three outer segments display detailed proportions, enabling audiences to grasp both overall composition and component breakdown simultaneously.
-
How to Use
Apply to business investment pitches, market analysis reports, financial performance reviews, and marketing strategy presentations where ratio-based data is critical. The integrated data table on the right side allows real-time numerical input with automatic chart synchronization, streamlining presentation updates.
-
Recommended For
Ideal for finance teams, investment managers, marketing strategists, and executives. Particularly effective for quarterly earnings reports, investment portfolio composition, market segmentation analysis, customer distribution explanations, and data-driven decision-making scenarios.
-
Slide Structure
2-slide set with consistent layout: left side features a 3-segment donut graph with central value indicator; right side contains a data input table (3 rows × 3 columns). Slide 1 uses blue palette (dark blue, medium blue, light blue); Slide 2 uses green palette (dark green, medium green, light green).
Related Products
-

Development Status Analysis Chart - Visualization for Effective Market Analysis
#Product/Service Introduction #Market and Competitor Analysis #Diagram
-

Market Environment Analysis Chart – A Visual Indicator for Data Analysis
#Product/Service Introduction #Market and Competitor Analysis #Diagram
-

Mobile Development Status Analysis Graph – Market Analysis and Competitiveness
#Product/Service Introduction #Market and Competitor Analysis #Diagram
-

Shareholder Status Analysis Donut Chart – Insights and Analysis
#Company Introduction #Market and Competitor Analysis #Diagram
