Businessman Cartoon Theme Circle Graph – Market Analysis and Competitiveness
RJ0300072_18
- Last Update 05/08/2025
- File Size 0.5MB
- # of Slides 2
- File Format PPTX
- Slide Ratio 16:9
- Color
Keywords
- #Content-Based Slides
- #Design-Based Slides
- #Product/Service Introduction
- #Market and Competitor Analysis
- #Graph
- #Development Status
- #Market Analysis
- #Circles
- #Doughnut Chart
- #16:9
- #donut chart PowerPoint slide
- #pie chart presentation template
- #ratio visualization
- #market share PPT
- #how to create donut chart in PowerPoint
About the Product
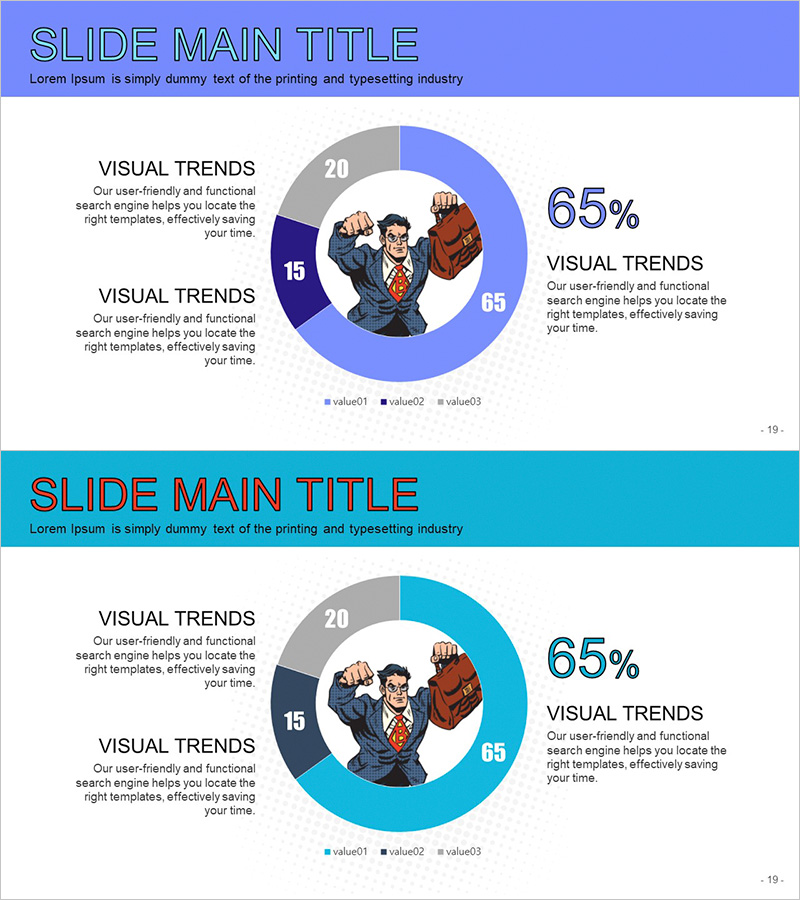
A donut-shaped pie chart PowerPoint slide featuring a businessman cartoon character. The donut chart uses three color segments in blue, gray, and navy tones to intuitively represent ratio data such as market share, competitive landscape, and customer composition. The 2-slide layout includes a header area at the top and left-side text explanation space for clear data interpretation. In 16:9 widescreen PPTX format, the slides are fully editable, allowing you to customize percentages and legend labels for various presentation scenarios including quarterly reports, market analysis, and strategic planning.
Usage Points
-
Main Usage
Visualizes market share, customer composition, revenue distribution, and competitive comparison by clearly showing parts relative to the whole. The donut center space allows emphasis of key metrics or percentages, drawing audience attention to critical data points.
-
How to Use
Ideal for business presentations, marketing strategy reports, quarterly performance analysis, and customer segmentation presentations. Add analysis content in the left text area to enhance chart interpretation and provide context for data-driven decision making.
-
Recommended For
Marketing managers, sales directors, executives, management consultants, and data analysts who need to communicate quantitative ratio information persuasively. The cartoon character softens the formal tone while maintaining professional credibility in business settings.
-
Slide Structure
2-slide layout with blue header area for title, center donut chart with 3 segments (65%, 20%, 15% ratio display), two text blocks on left side, and 65% emphasis figure on right. Legend positioned at bottom clearly distinguishes data categories and values.
Related Products
-

Development Status Analysis Donut-Shaped Circle Graph
#Product/Service Introduction #Market and Competitor Analysis #Graph
-

Development Analysis Donut Graph – Visual Data Presentation
#Product/Service Introduction #Market and Competitor Analysis #Graph
-

Research Ratio Analysis Graph – Analyzing Market Dynamics
#Product/Service Introduction #Market and Competitor Analysis #Graph
-

Idea Development Status Donut Graph – Effective Market Analysis
#Product/Service Introduction #Market and Competitor Analysis #Graph
