Business Market Analysis Donut Circle Chart – Visualizing Competitive Advantage
RJ0400061_5
- Last Update 06/03/2025
- File Size 0.9MB
- # of Slides 2
- File Format PPTX
- Slide Ratio 16:9
- Color
Keywords
About the Product
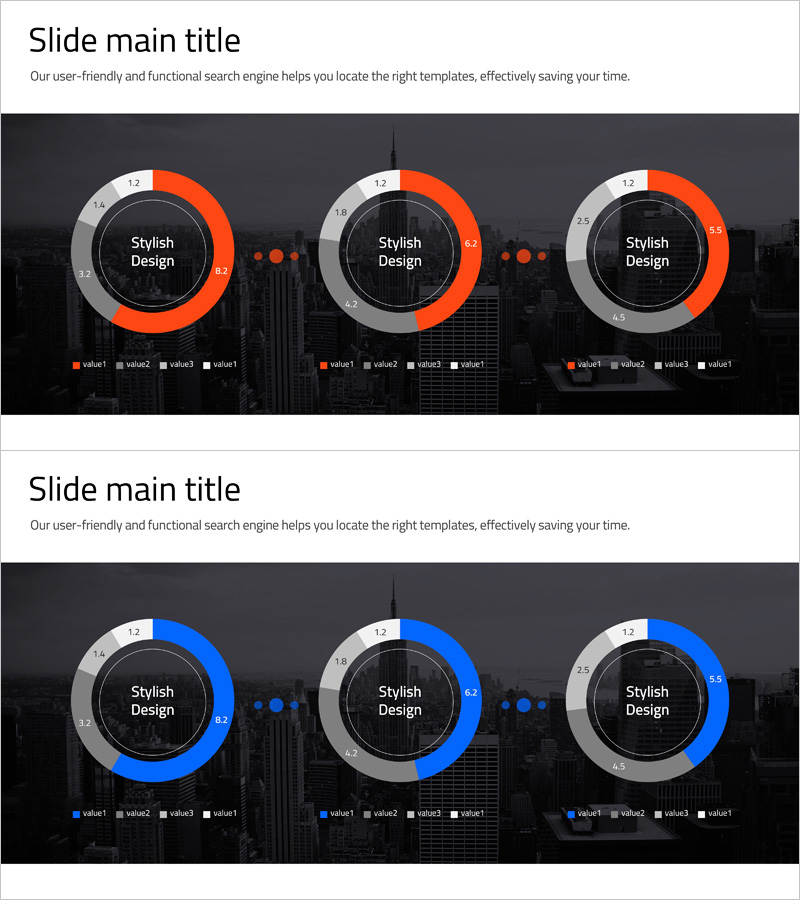
A professional donut chart PowerPoint slide designed for business market analysis and competitive comparison. The slide features three donut charts on a dark background with orange and blue accent colors, each displaying data ratios across four segments. A central text area labeled 'Stylish Design' allows you to emphasize key messages, while a legend at the bottom identifies value1 through value4 categories. The 2-slide set includes a matching layout variation, making it ideal for presenting multiple market analyses or competitor benchmarks. Delivered in 16:9 widescreen PPTX format for immediate editing and data customization.
Usage Points
-
Main Usage
Effectively visualize proportional data such as market share, competitor positioning, customer segmentation, and revenue distribution across four categories. The hollow center of the donut chart provides space to highlight key metrics or insights, drawing audience attention to critical findings.
-
How to Use
Replace the data values in each donut chart with your actual figures and update the legend labels from value1–value4 to your category names. Insert your analysis conclusions or key takeaways in the central text area to align with your presentation narrative and business context.
-
Recommended For
Ideal for marketing strategy presentations, business analysis reports, investor pitch decks, and executive briefings. Suitable for marketing teams, strategy consultants, sales organizations, and business analysts presenting market positioning, competitive landscape, and customer insights.
-
Slide Structure
Two-slide set with three donut charts per slide arranged horizontally. Each donut chart displays four data segments color-coded for clarity. Includes a central text placeholder and a four-item legend at the bottom. Dark background with orange and blue accent colors enhances data readability and visual impact.
Related Products
-

Visualizing Competitive Analysis with Table and 3 Donut Graphs
#Market and Competitor Analysis #Diagram #Graph
-

Competitor Revenue Analysis Chart – Visualize Market Dynamics
#Market and Competitor Analysis #Diagram #Graph
-

Blue Orange Market Analysis Donut Chart – Essence of Data Visualization
#Market and Competitor Analysis #Graph #Competitor Analysis
-

Competitor Comparison Donut Chart – Effective Tool for Market and Competitive Analysis
#Market and Competitor Analysis #Graph #Competitor Analysis
