Medical Comparative Analysis Donut Circle Graph – Effective Market Analysis
RJ0400023_9
- Last Update 05/24/2025
- File Size 4.6MB
- # of Slides 2
- File Format PPTX
- Slide Ratio 16:9
- Color
Keywords
About the Product
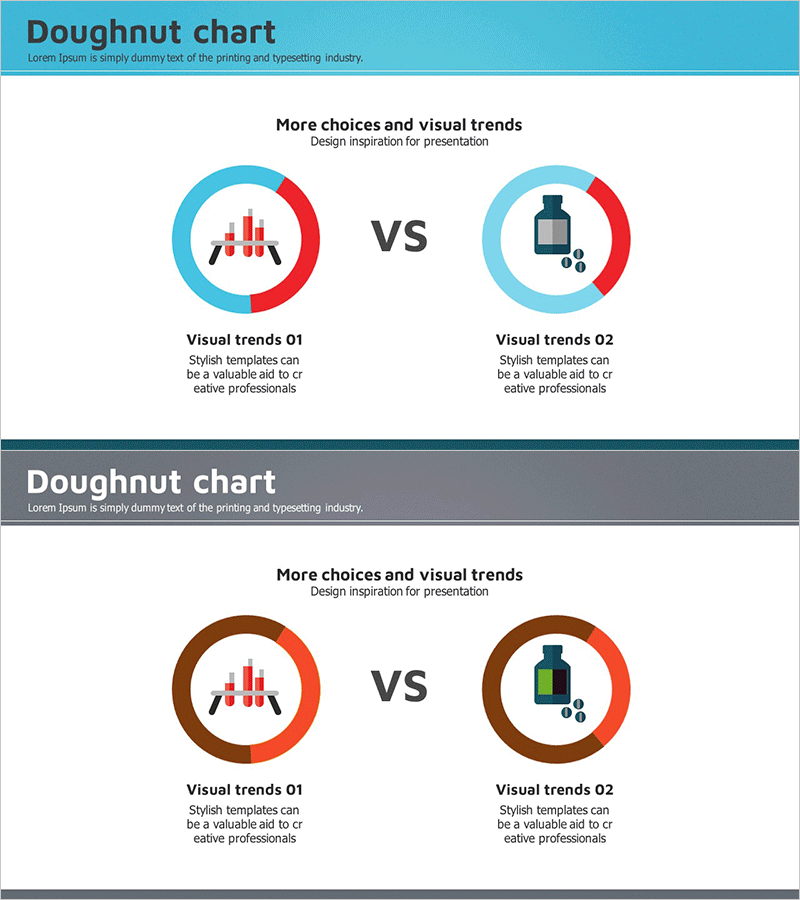
A donut chart PowerPoint slide optimized for medical and pharmaceutical market analysis and competitive comparison. The design features a light blue and red two-tone background with a central icon placement, allowing visual contrast between two data series. The 2-slide set provides multiple color combinations (blue and brown tones) and is optimized for 16:9 widescreen format. This presentation template enables clear visualization of numerical ratios in medical reports, market analysis presentations, and executive briefings, making complex data intuitive and accessible.
Usage Points
-
Main Usage
Visualizes two data series simultaneously, such as medical market size, competitor market share, and product ratio comparisons. The donut structure allows placement of key metrics or icons in the center, increasing visual focus and enabling clear communication of complex numerical data in medical reports and executive presentations.
-
How to Use
Double-click the donut chart area to input data or modify colors. Insert medical institution logos or product images in the center icon area to strengthen brand identity, and edit text labels to clearly identify comparison items. All elements are fully editable in PowerPoint.
-
Recommended For
Medical and pharmaceutical company market analysis presentations, hospital and healthcare facility executive reports, medical consulting firm competitive analysis materials, pharmaceutical product positioning presentations, and healthcare investment pitch decks.
-
Slide Structure
Two-slide set with each slide featuring two donut charts arranged side-by-side. Each donut is segmented in two-tone colors (blue and red, or brown and orange), with a center area for inserting medical-related symbols such as bar graphs or bottle icons. Bottom section includes 'Visual trends' label and descriptive text area for annotations.
Related Products
-

Donut Circle Graph & Cube Graph – Optimized for Market & Competitor Analysis
#Market and Competitor Analysis #Graph #Other
-

Healthcare Analytics Donut Graph – Visualizing Market Insights
#Market and Competitor Analysis #Graph #Competitor Analysis
-

Blue Orange Market Analysis Donut Chart – Essence of Data Visualization
#Market and Competitor Analysis #Graph #Competitor Analysis
-

Contribution-Based Performance Chart – Infographic for Market Analysis
#Market and Competitor Analysis #Graph #Competitor Analysis
