Healthcare Analytics Donut Graph – Visualizing Market Insights
RJ0700016_5
- Last Update 07/26/2025
- File Size 0.4MB
- # of Slides 2
- File Format PPTX
- Slide Ratio 16:9
- Color
Keywords
- #Content-Based Slides
- #Design-Based Slides
- #Market and Competitor Analysis
- #Graph
- #Competitor Analysis
- #Market Analysis
- #Circles
- #Doughnut Chart
- #16:9
- #donut chart PowerPoint
- #pie chart slide template
- #healthcare data visualization
- #market share chart
- #4-segment donut graph
- #business analytics slide
- #healthcare presentation template
About the Product
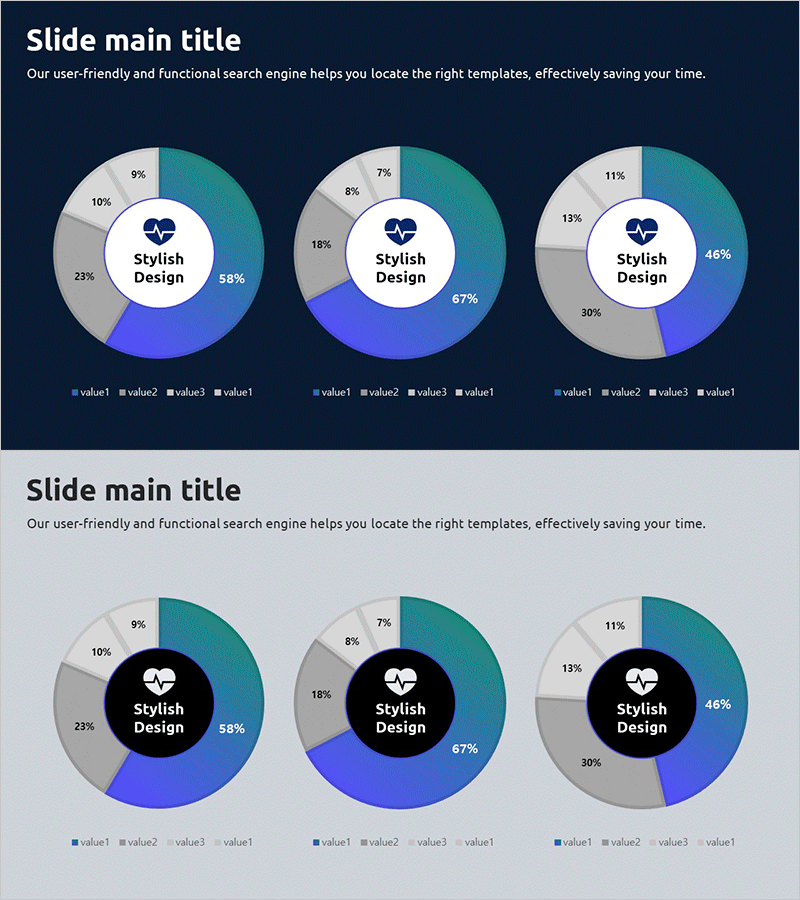
A 2-slide donut chart PowerPoint template designed for healthcare industry analysis and market insights. Set against a dark blue background, the slides feature 4-segment pie charts in teal, gray, and blue tones to visualize market share, competitive positioning, patient distribution, and service composition ratios. The center circular area accommodates key messages, logos, or icons, while percentage values are clearly displayed for each segment. Ideal for healthcare executives, pharmaceutical companies, and medical consultants presenting to boards, investors, and stakeholders in quarterly reports, pitch decks, and market analysis presentations.
Usage Points
-
Main Usage
Visualize healthcare market share, competitive positioning, patient demographics, and service composition ratios across 4 segments using donut chart design. The center circular area emphasizes brand identity and key messaging by accommodating logos, icons, or core statistics.
-
How to Use
Apply to executive dashboards, investor presentations (IR decks), market analysis reports, and business proposals. Edit segment percentages with your own data, customize legends and titles to match presentation context, and adjust color coding to align with corporate branding guidelines.
-
Recommended For
Healthcare executives, medical consultants, pharmaceutical marketing teams, hospital administrators, healthcare startup founders, industry analysts, and investment presenters who need to communicate market dynamics and competitive landscape to boards and investors.
-
Slide Structure
2-slide set with dark blue background. Each slide contains one 4-segment donut chart with teal, gray, blue, and light blue color coding. Percentage values are positioned on each segment, and the center circular area is designed as an editable zone for logos, text, or supplementary icons.
Related Products
-

Market Segmentation Analysis Table & Donut Chart for Market Insights
#Market and Competitor Analysis #Diagram #Graph
-

Competitor Revenue Analysis Chart – Visualize Market Dynamics
#Market and Competitor Analysis #Diagram #Graph
-

Survey and Poll Analysis Graphs – Optimized for Market Analysis
#Market and Competitor Analysis #Diagram #Graph
-

Business Market Analysis Donut Circle Chart – Visualizing Competitive Advantage
#Market and Competitor Analysis #Graph #Competitor Analysis
