The Road Presentation Table – Sales and Performance Management
RJ0200032_25
- Last Update 04/06/2025
- File Size 0.4MB
- # of Slides 2
- File Format PPTX
- Slide Ratio 16:9
- Color
Keywords
- #Content-Based Slides
- #Design-Based Slides
- #Financial Plans and Performance
- #Diagram
- #Sales and Revenue
- #Table
- #Standard Table
- #16:9
- #roadmap table PowerPoint
- #performance management slide template
- #financial planning table design
- #roadmap diagram PowerPoint slide
- #how to create roadmap table in PowerPoint
About the Product
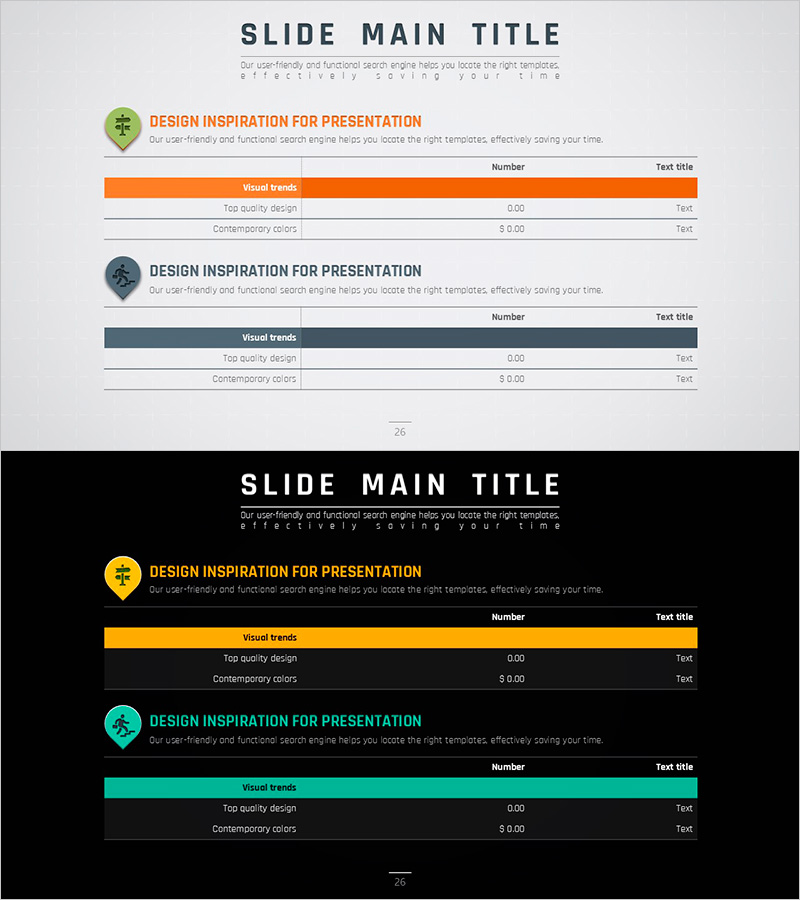
A roadmap table PowerPoint slide designed for sales and performance management presentations. This 2-slide set features a two-tone color scheme combining orange and gray to create clear visual hierarchy. Each table is structured as a 3-stage roadmap with an icon section on the left and a data entry area on the right, enabling efficient information organization. The slides are ready to use for financial planning, performance analysis, project status updates, and other business presentations.
Usage Points
-
Main Usage
Visualize sales and performance management data in a stage-by-stage roadmap format. The 3-stage structure clearly displays progress over time, goal achievement rates, and performance indicators. The separation of icon/label area on the left and data entry area on the right maximizes information delivery efficiency.
-
How to Use
Use in business plans, quarterly performance reports, financial planning presentations, and project status updates. Edit each stage to show targets, actual results, and achievement rates, or adapt the structure for departmental performance comparisons, year-over-year revenue trends, and other data scenarios.
-
Recommended For
CFOs, finance managers, project managers, business development teams, and performance management professionals presenting to executives, investors, or internal stakeholders. Ideal for situations requiring simultaneous communication of quantitative data and progress status.
-
Slide Structure
2-slide set. Each slide features a 3-stage roadmap table with icon or stage label on the left, 'Visual trends' header in the center, and 'Number' and 'Text title' input areas on the right. Two color variations provided: orange header and gray header versions.
Related Products
-

Income Statement Table – Clear Visualization of Financial Performance
#Financial Plans and Performance #Diagram #Income Statement
-

Triangle Pattern Column Chart Presentation Template
#Market and Competitor Analysis #Financial Plans and Performance #Diagram
-

KPI Target vs Actual Slide – 4-Metric Dark Red & Purple
#Company Introduction #Business Strategy #Financial Plans and Performance
-

Sales and Profit Analysis Table – Essential Tool for Presentation
#Financial Plans and Performance #Diagram #Other
