Orange Red Point Table – Visualization of Financial Performance
RJ0800046_23
- Last Update 08/13/2025
- File Size 0.2MB
- # of Slides 2
- File Format PPTX
- Slide Ratio 16:9
- Color
Keywords
- #Content-Based Slides
- #Design-Based Slides
- #Financial Plans and Performance
- #Diagram
- #Sales and Revenue
- #Key Financial Indicators
- #Table
- #Standard Table
- #16:9
- #data table PowerPoint slide
- #financial performance template
- #6-column table PPT
- #financial metrics visualization
- #business data presentation
- #orange red table slide
About the Product
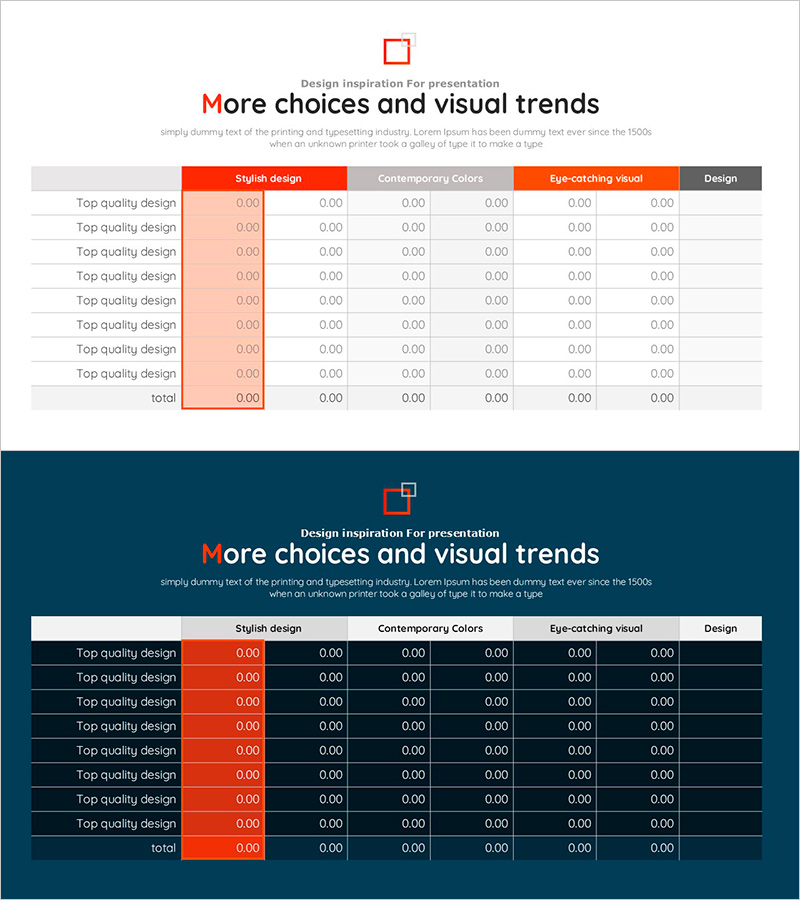
A 6-column data table PowerPoint slide designed to clearly present financial performance and key metrics. The orange red header contrasts sharply with the white background, maximizing data readability, while row dividers ensure organized information layout. This PPT template effectively visualizes revenue, sales, profit margins, and other financial figures, making it ideal for quarterly and annual performance reports, investor presentations, and executive briefings. The 2-slide set provides flexible data layout options for various financial scenarios.
Usage Points
-
Main Usage
Presents financial figures, performance metrics, and comparative data in a structured table format for clear audience comprehension. The orange red header emphasizes critical information while row dividers create visual separation between data entries.
-
How to Use
Apply to quarterly and annual financial reports, investor presentations, executive briefings, and business plan financial sections. Simply edit cell contents to input actual revenue, sales, and profit margin data for immediate presentation use.
-
Recommended For
CFOs, finance managers, executives, and investor relations professionals presenting financial performance. Particularly suitable for board meetings, shareholder meetings, and presentations to financial institutions requiring data-driven decision-making.
-
Slide Structure
Structured as a 6-column × multi-row data table. The header row features an orange red background with item labels, while subsequent rows display data on a white background with black text. Row dividers clearly separate each data entry. The 2-slide set accommodates multiple financial data presentations.
Related Products
-

Minimal Block Table for Revenue and Profit Analysis – Emphasizing Financial Performance
#Financial Plans and Performance #Diagram #Sales and Revenue
-

Sales and Profit Table – Statistical Financial Performance
#Financial Plans and Performance #Diagram #Sales and Revenue
-

Farm Key Financial Indicators Table Chart – Intuitive Presentation of Financial Performance
#Financial Plans and Performance #Diagram #Sales and Revenue
-

Blue Line Wide Template Table1
#Financial Plans and Performance #Diagram #Sales and Revenue
