Business Goals Sales and Profits – Strategic Diagram Design
RJ0300071_19
- Last Update 05/08/2025
- File Size 0.7MB
- # of Slides 2
- File Format PPTX
- Slide Ratio 16:9
- Color
Keywords
- #Content-Based Slides
- #Design-Based Slides
- #Business Vision and Strategy
- #Financial Plans and Performance
- #Diagram
- #Business Goals
- #Sales and Revenue
- #Cluster
- #Table
- #Closed Cluster Diagram
- #16:9
- #hexagon cluster diagram PowerPoint
- #business goals diagram slide
- #sales revenue visualization
- #relationship diagram template
- #strategic diagram PowerPoint slide
About the Product
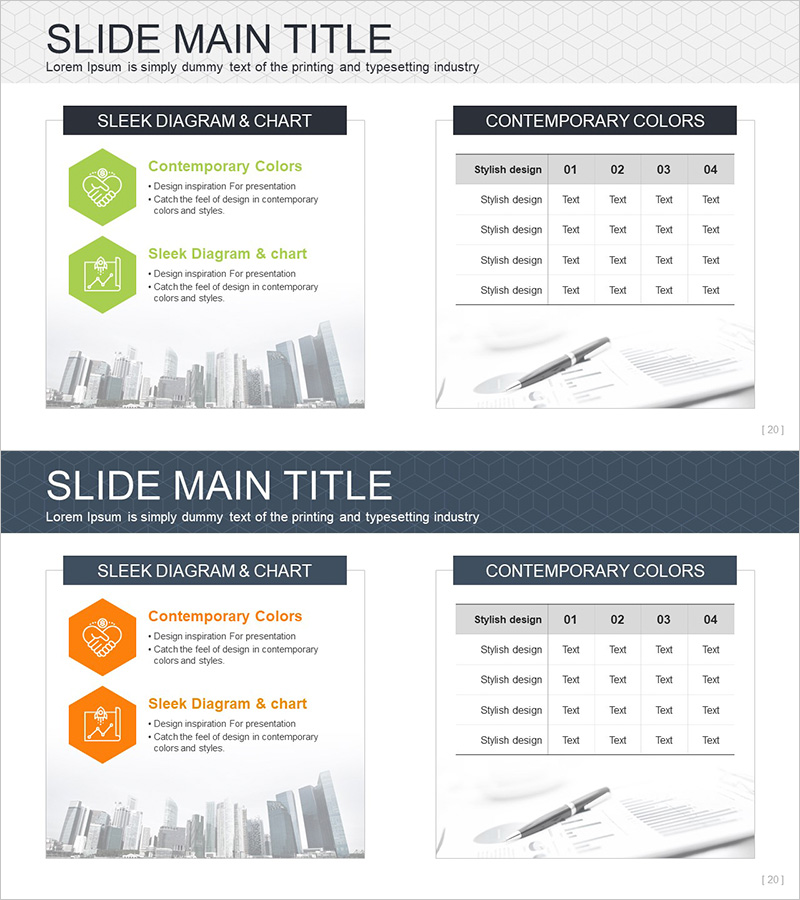
A hexagon cluster diagram PowerPoint slide that visually connects business goals, sales, and revenue metrics. Available in two color versions—lime green and orange—each featuring a central core objective that expands to surrounding detail items, representing strategic relationships. Perfect for financial planning, strategy presentations, and performance reporting in business contexts. The 2-slide set is fully editable, formatted in 16:9 widescreen PPTX.
Usage Points
-
Main Usage
Illustrate corporate financial objectives and execution strategies in a hierarchical structure. The diagram radiates from a central goal outward to sub-items like revenue generation and profit maximization, making strategic connections transparent and actionable.
-
How to Use
Deploy in business plan presentations, quarterly performance reviews, investor pitches, and executive meetings to explain the relationship between business targets and financial metrics. Customize each hexagon with specific targets, strategies, or department ownership to communicate organizational alignment.
-
Recommended For
CFOs, finance managers, business planning teams, business development professionals, and consultants who manage both strategic and financial performance. Ideal for organizations requiring goal setting, performance measurement, and strategy adjustment cycles.
-
Slide Structure
2-slide deck featuring a cluster of 3 hexagons (1 central + 2 surrounding) in lime green on the first slide, replicated in orange on the second. Each hexagon is independently editable with clearly marked text input areas for customization.
Related Products
-

Financial Services Revenue Analysis Table – Intuitive Financial Data Visualization
#Financial Plans and Performance #Diagram #Sales and Revenue
-

Business Profit Analysis Table – Financial Performance and Strategy Analysis
#Financial Plans and Performance #Diagram #Sales and Revenue
-

Sales and Profit Table – Statistical Financial Performance
#Financial Plans and Performance #Diagram #Sales and Revenue
-

Key Performance Table Diagram for Visualizing Business Goals – Performance-Based Strategy
#Company Introduction #Business Vision and Strategy #Diagram
