Orange Hexagon Presentation Template Table – Visualization of Revenue and Profit
RJ0200038_15
- Last Update 04/08/2025
- File Size 0.9MB
- # of Slides 2
- File Format PPTX
- Slide Ratio 16:9
- Color
Keywords
- #Content-Based Slides
- #Design-Based Slides
- #Financial Plans and Performance
- #Diagram
- #Sales and Revenue
- #Key Financial Indicators
- #Table
- #Standard Table
- #16:9
- #hexagon table PowerPoint slide
- #financial data presentation template
- #table diagram PPT
- #orange table design
- #revenue profit visualization slide
- #business table PowerPoint download
About the Product
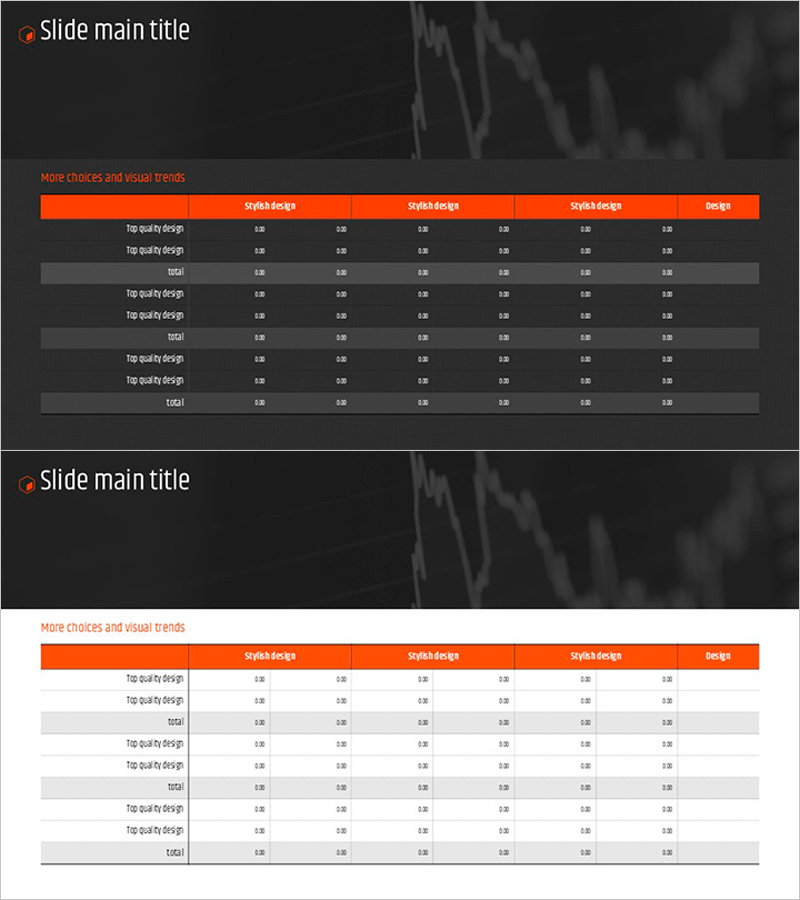
A hexagon-structured table PowerPoint slide featuring an orange header and gray rows for organizing financial data. The 6-column layout with 3 sections enables clear presentation of revenue, profit, and quality metrics across multiple categories. Both slides maintain consistent formatting for cohesive presentations in 16:9 widescreen format. All cells are fully editable, allowing you to input actual data immediately without design modifications. Perfect for quarterly reports, performance reviews, and financial analysis presentations.
Usage Points
-
Main Usage
Designed for financial reports, quarterly performance presentations, and departmental analysis where numerical data must be clearly communicated in tabular format. The orange header emphasizes critical information while gray row divisions enhance data readability and visual hierarchy.
-
How to Use
Open the slide and input your financial metrics—revenue, profit, quality indicators—into each cell. Replace row labels (product quality design, product design) with your organization's categories and modify column headers (stylish design, design) to reflect quarters or business units.
-
Recommended For
Finance teams, sales departments, executives preparing reports, quarterly performance presenters, and professionals requiring budget planning and performance comparison analysis. Ideal for data-driven decision-making meetings and financial review sessions.
-
Slide Structure
Both slides feature identical 6-column × 3-section table layouts. The orange header row contains 5 column titles plus 1 design column. Each section includes 2 data rows and 1 total row, providing 9 editable data entry areas per slide for comprehensive financial information display.
Related Products
-

Grain Yield Table – Financial Planning and Performance
#Financial Plans and Performance #Diagram #Sales and Revenue
-

Line PPT Table (Green & Orange) – Visualizing Financial Performance Data
#Financial Plans and Performance #Diagram #Sales and Revenue
-

Effective Data Table Slide – Financial Planning and Performance
#Financial Plans and Performance #Diagram #Sales and Revenue
-

Visualizing Key Financial Indicators with Diagram Presentation
#Financial Plans and Performance #Diagram #Sales and Revenue
