Segmented Horizontal Bar Graph Slide - Market and Competitor Analysis
RJ0300095_25
- Last Update 05/16/2025
- File Size 0.3MB
- # of Slides 2
- File Format PPTX
- Slide Ratio 16:9
- Color
Keywords
- #Content-Based Slides
- #Design-Based Slides
- #Market and Competitor Analysis
- #Graph
- #Competitor Analysis
- #Market Analysis
- #Horizontal Bar
- #Segmented Horizontal Bar
- #16:9
- #segmented horizontal bar chart PowerPoint
- #horizontal bar graph slide
- #market analysis chart
- #competitor analysis slide
- #multi-series data visualization
- #bar chart PowerPoint template
About the Product
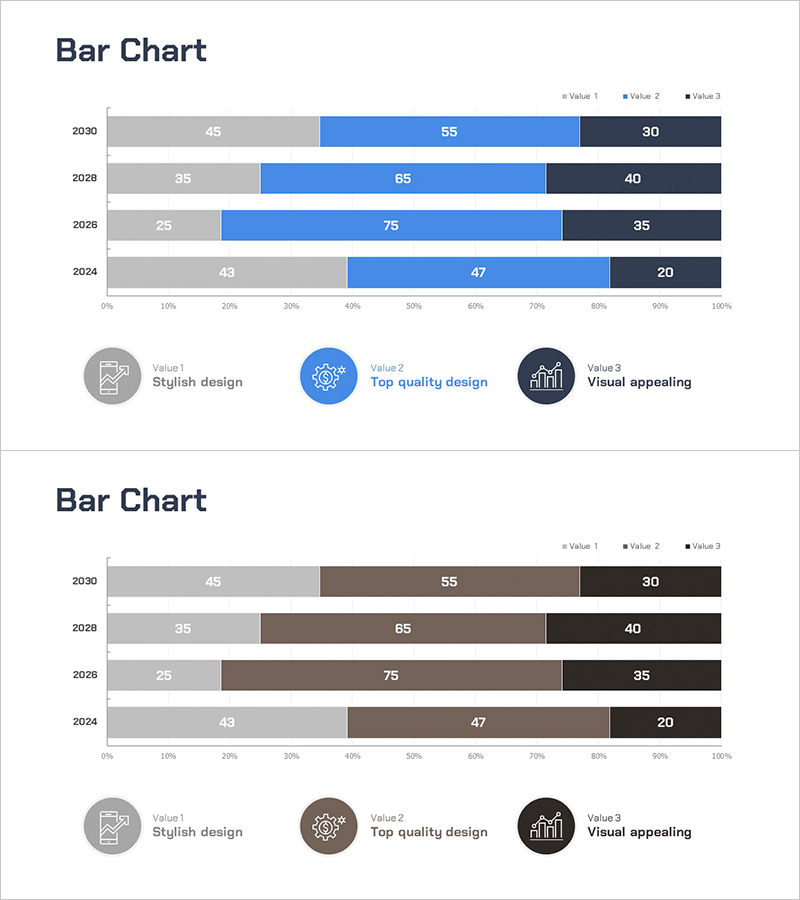
A segmented horizontal bar chart PowerPoint slide optimized for market and competitor analysis presentations. The slide features three data series in gray, blue, and dark navy colors, displaying year-over-year comparisons from 2024 to 2030. Each year shows three distinct values arranged horizontally, enabling clear item-to-item comparison and trend analysis across years. This presentation template effectively visualizes complex datasets such as competitive positioning, market share, and performance metrics in business plans, reports, and strategic proposals.
Usage Points
-
Main Usage
Compare three or more data points across multiple years, such as market size, market share, or competitor performance. The horizontal layout accommodates longer category names clearly, while color differentiation makes each data series instantly recognizable.
-
How to Use
Insert into the market analysis or competitive analysis section of business plans, marketing proposals, or quarterly reports. Replace the legend labels and numerical values with your own data for immediate use. Colors, fonts, and values can be customized to match your corporate branding.
-
Recommended For
Ideal for marketing teams, strategy departments, and executive presentations. Effective for situations requiring multi-item comparisons such as market research, competitive positioning, performance evaluation, and budget allocation. Suitable for board meetings, investor presentations, and internal reporting materials.
-
Slide Structure
Two-slide set. Each slide presents four years (2024, 2026, 2028, 2030) with three data series (Value 1, Value 2, Value 3) displayed as horizontal bars. Includes legend, title, and axis labels. Optimized for 16:9 widescreen format.
Related Products
-

Space Industry Market Analysis Bar Graph – Providing Strategic Insights
#Market and Competitor Analysis #Graph #Competitor Analysis
-

Segmented Graph of Learning Goal Achievement – Market and Competitor Analysis
#Market and Competitor Analysis #Graph #Competitor Analysis
-

Market Analysis Bar Graph – Effective Visualization for Competitor Analysis
#Market and Competitor Analysis #Graph #Competitor Analysis
-

Financial Management Analysis Detailed Graph
#Market and Competitor Analysis #Graph #Competitor Analysis
