Space Shuttle Graph for Data Visualization – Creativity and Innovation
RJ0700024_15
- Last Update 08/29/2025
- File Size 3.1MB
- # of Slides 2
- File Format PPTX
- Slide Ratio 16:9
- Color
Keywords
About the Product
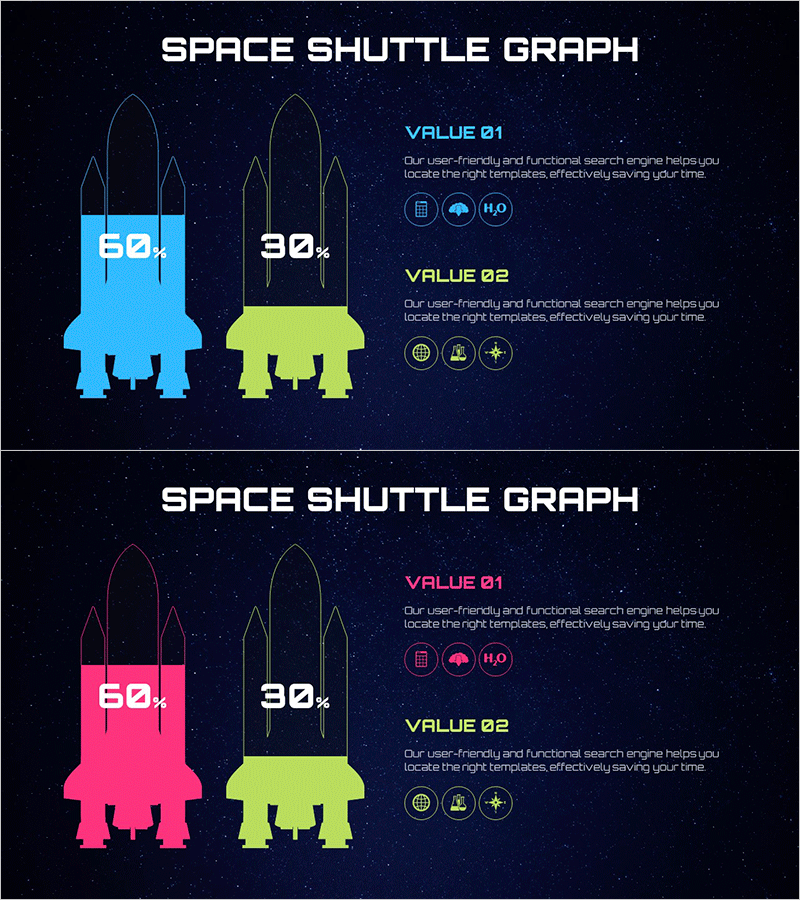
A creative comparison chart PowerPoint slide featuring space shuttle silhouettes for data visualization. Set against a dark navy cosmic background, two shuttle silhouettes in cyan and lime green display data values of 60% and 30% respectively. Space-themed icons and text areas accompany the design, making this slide set ideal for technology, innovation, and future-focused presentations. The 16:9 widescreen format includes 2 fully editable slides ready for immediate use.
Usage Points
-
Main Usage
Optimized for expressing data comparisons in technology, innovation, and future-oriented presentations. The shuttle silhouettes effectively highlight abstract concepts and performance metrics, while the cosmic background and icon set reinforce creativity and innovation messaging throughout the presentation.
-
How to Use
Use in technology company pitches, startup presentations, scientific research briefings, and product comparison analyses. Edit the percentage values inside each shuttle to reflect actual data, then add item names and descriptions in the VALUE 01 and VALUE 02 text areas on the right side.
-
Recommended For
Ideal for executive presentations at tech companies and startups, investment pitch decks, technology innovation case studies, product performance comparisons, and marketing strategy presentations requiring a forward-thinking visual identity.
-
Slide Structure
2-slide set with dark navy cosmic background on each slide. Two space shuttle silhouettes (cyan and lime green) are positioned with percentage values on the left shuttle and VALUE 01/02 labels with description text areas on the right. Space-themed icon sets represent data categories.
Related Products
-

SEO System Comparison Analysis Bar Graph
#Market and Competitor Analysis #Graph #Competitor Analysis
-

Competitor and Market Analysis Slide Design - Harmony of Blue and Yellow
#Market and Competitor Analysis #Diagram #Graph
-

Vertical Bar Graph for Market and Competitor Analysis – Professional Data Visuals
#Market and Competitor Analysis #Graph #Competitor Analysis
-

Comparative Analysis Bar Graph & Table – Optimized for Market and Competitor Analysis
#Market and Competitor Analysis #Diagram #Graph
