Business Market Analysis Bar Graph – Visualizing Competitive Analysis
RJ0400069_15
- Last Update 06/06/2025
- File Size 4.3MB
- # of Slides 2
- File Format PPTX
- Slide Ratio 16:9
- Color
Keywords
- #Content-Based Slides
- #Design-Based Slides
- #Market and Competitor Analysis
- #Diagram
- #Graph
- #Text Box
- #Competitor Analysis
- #Market Analysis
- #Column
- #Column Chart
- #Rectangle Text Box
- #16:9
- #horizontal bar chart PowerPoint
- #competitive analysis slide template
- #market analysis presentation
- #bar graph template download
- #business comparison chart
About the Product
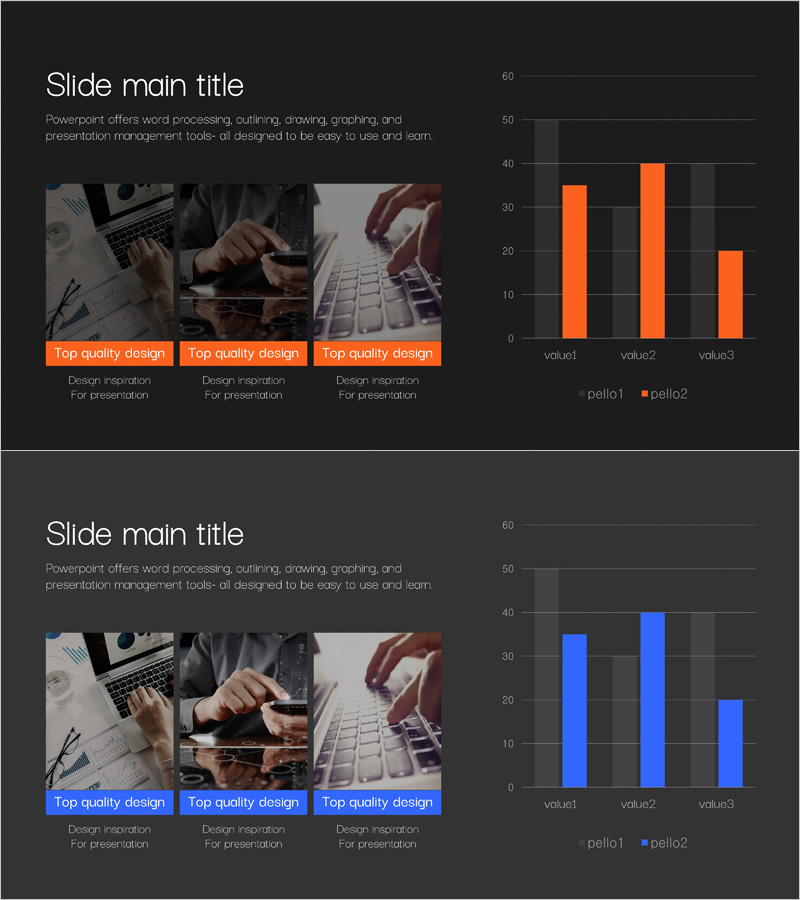
A horizontal bar chart PowerPoint slide designed for market analysis and competitive comparison. Set against a dark gray background, the orange-toned bars clearly visualize data across three items with dual-series representation. This presentation template is optimized for business pitches to convey competitive positioning intuitively, featuring two fully editable slides ready for immediate use.
Usage Points
-
Main Usage
Expresses numerical comparisons such as market analysis, competitor benchmarking, and sales performance using horizontal bars for clarity. Simultaneously displays two data series across three items, enabling relative size comparison and trend identification.
-
How to Use
Use in business presentations, market research reports, and executive briefings to explain competitive landscape or performance metrics. The dark gray background conveys professionalism while orange accent color highlights key data points.
-
Recommended For
Marketing managers, sales directors, business analysts, and consultants requiring data-driven decision-making. Ideal for market analysis, competitive analysis, and performance evaluation presentations.
-
Slide Structure
Two-slide set with orange bars on the first slide and blue bars on the second for color variation. Each slide arranges three items (value1, value2, value3) and two data series (pello1, pello2) horizontally to emphasize item-to-item comparison.
Related Products
-

Comparative Analysis Bar Graph & Table – Optimized for Market and Competitor Analysis
#Market and Competitor Analysis #Diagram #Graph
-

Competitor and Market Analysis Slide Design - Harmony of Blue and Yellow
#Market and Competitor Analysis #Diagram #Graph
-

Characteristics of Seasonal Forests – Market and Competitor Analysis
#Market and Competitor Analysis #Diagram #Text Box
-

Concise Analysis Column Graph & Table Slide
#Market and Competitor Analysis #Diagram #Graph
