Galaxy Theme Market Share Pie Chart
RJ0400001_9
- Last Update 05/17/2025
- File Size 13.9MB
- # of Slides 2
- File Format PPTX
- Slide Ratio 16:9
- Color
Keywords
- #Content-Based Slides
- #Design-Based Slides
- #Product/Service Introduction
- #Market and Competitor Analysis
- #Graph
- #Composition
- #Market Share
- #Circles
- #Pie Chart
- #16:9
- #pie chart PowerPoint slide
- #market share chart template
- #data visualization slide
- #percentage breakdown presentation
- #editable pie graph
- #galaxy theme slide design
About the Product
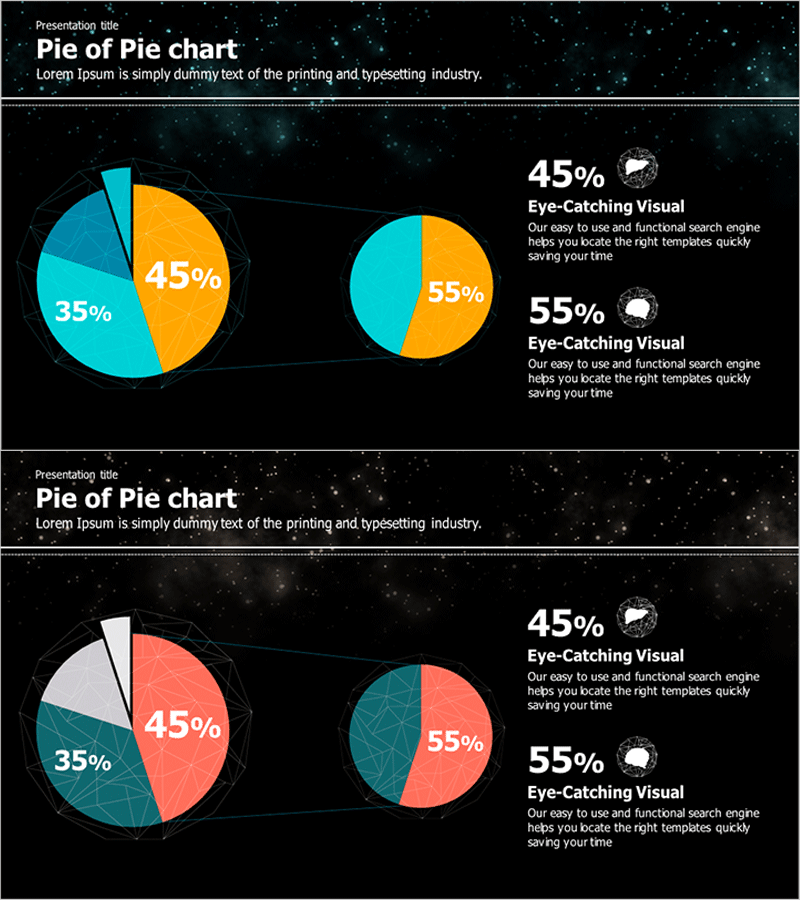
A 2-slide pie chart presentation set featuring a dark galaxy-themed background with cyan, orange, and white color segments. The first slide displays a large 3-segment pie chart, while the second slide shows a smaller 2-segment pie chart, enabling direct comparison of market share, sales ratios, and customer composition data. Each segment includes percentage labels and icons for enhanced visual clarity. Fully editable in PowerPoint format, this template is ideal for business reports, market analysis presentations, and strategic planning documents.
Usage Points
-
Main Usage
Effectively communicates proportional data such as market share, sales distribution, customer demographics, and budget allocation. The combination of large and small pie charts allows simultaneous presentation of overall trends and detailed comparisons.
-
How to Use
Insert into market analysis sections of business reports, competitive landscape pages in business plans, and customer analysis slides in marketing presentations. Double-click percentage values to update with actual data, and adjust segment colors to match corporate branding guidelines.
-
Recommended For
Finance professionals, marketing managers, business analysts, management consultants, and executives who need to present quantitative data in visually compelling formats for decision-making.
-
Slide Structure
Slide 1: Title area + large 3-segment pie chart (45%, 35%, 20% distribution) + right-aligned text description zone. Slide 2: Title area + smaller 2-segment pie chart (45%, 55% distribution) + right-aligned text description zone. All segments include icons and percentage labels.
Related Products
-

Nutrient Intake Distribution Pie Chart – Analysis of Dietary Composition
#Product/Service Introduction #Market and Competitor Analysis #Graph
-

Donut Type Male and Female Analysis Chart – Customer Preference Analysis
#Market and Competitor Analysis #Graph #Customer Analysis
-

Sugar Type Analysis Pie Chart
#Product/Service Introduction #Market and Competitor Analysis #Graph
-

Modern Theme Pie Chart – Market Share Analysis
#Product/Service Introduction #Market and Competitor Analysis #Graph
