Diagram Introducing Effective Farming Methods
RJ0600096_24
- Last Update 07/17/2025
- File Size 0.1MB
- # of Slides 2
- File Format PPTX
- Slide Ratio 16:9
- Color
Keywords
About the Product
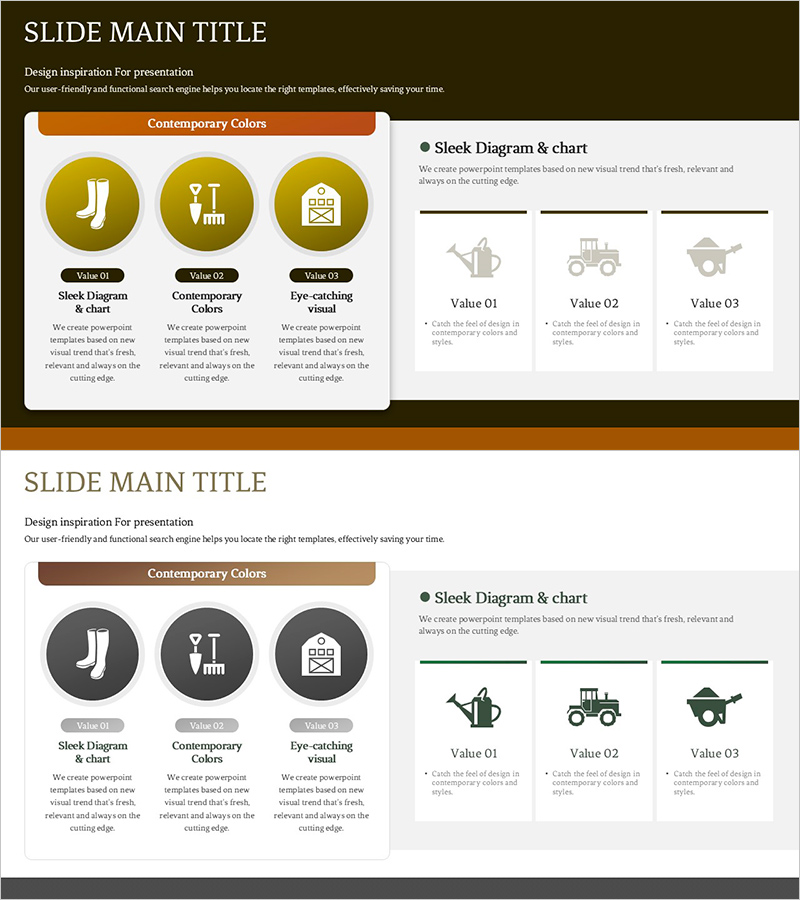
A 2-slide PowerPoint presentation designed to explain agricultural techniques and farming efficiency. Three circular icons in olive tones are arranged to visually compare different farming methods. The left section features key technology elements with icons and descriptive text, while the right section presents detailed information for each method in an organized layout. This presentation slide is ready to use for agricultural technology briefings, technical seminars, educational materials, and farming innovation discussions.
Usage Points
-
Main Usage
This slide effectively communicates agricultural techniques, cultivation methods, and efficiency improvements to your audience. The visual comparison of three farming approaches allows viewers to quickly understand the characteristics and advantages of each method at a glance.
-
How to Use
Use this slide during agricultural technology presentations, farming education seminars, and technical briefings to emphasize key points. Input technology names in the left icon area and detailed explanations in the right text area to enhance audience comprehension.
-
Recommended For
Recommended for agricultural technology specialists, farming educators, agricultural company presenters, and agricultural policy officers. Ideal for presentations on technological innovation, efficiency improvements, and sustainable farming practices.
-
Slide Structure
The 2-slide set features a left section with 3 circular icons (each with editable text below) and a right section with 3 value display areas (each with space for detailed descriptions). Olive and brown headers with gray backgrounds clearly distinguish information hierarchy.
Related Products
-

Construction Work Puzzle Diagram – Cluster-Based Structure
#Product/Service Introduction #Business Introduction #Diagram
-

Stylish Design Visual – Effective Presentation Material
#Product/Service Introduction #Business Introduction #Graph
-

Introduction to Work Tools – Product and Service Presentation
#Product/Service Introduction #Business Introduction #Composition
-

Business Technology Status Bar Graph – Insights Delivered Through Data Visualization
#Product/Service Introduction #Business Introduction #Graph
