Technology Status Radial Graph – Modern Design
RJ0700010_21
- Last Update 07/24/2025
- File Size 0.4MB
- # of Slides 2
- File Format PPTX
- Slide Ratio 16:9
- Color
Keywords
About the Product
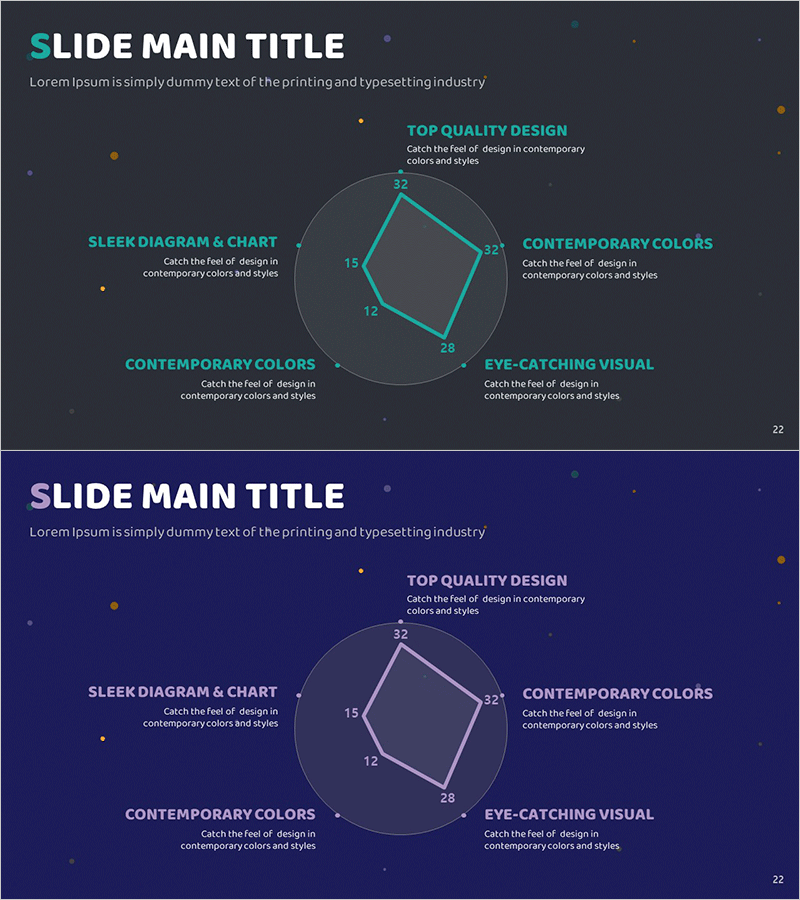
A PowerPoint slide featuring five key metrics arranged in a radial diagram with cyan lines and numerical labels on a dark background. Ideal for technology status reports, performance evaluations, and capability assessments where multi-dimensional comparison is essential. The radial layout enables viewers to instantly grasp relative strengths and weaknesses across all dimensions. Includes 2 slides in 16:9 format, fully editable for presentations, reports, and business communications.
Usage Points
-
Main Usage
Visualizes five key metrics simultaneously to compare relative performance levels across multiple dimensions. The radial arrangement makes it easy to identify strengths and weaknesses at a glance, making it ideal for technology reports, competitive analysis, capability assessments, and strategic presentations.
-
How to Use
Replace the numerical values (12, 15, 28, 32, 21) and item labels with your own data. The cyan lines and circular grid remain fixed, ensuring consistent design while you update only the content. The dark background displays clearly on projectors and prints with excellent color contrast.
-
Recommended For
Technology managers, R&D teams, consultants, and executives presenting performance metrics, capability evaluations, and market analysis. Suitable for IT, manufacturing, energy, finance, and other technology-driven industries in strategy meetings, investor presentations, and internal reports.
-
Slide Structure
Five items radiate outward from a central circular grid, each with numerical labels and descriptive text areas. Two-slide set with the first featuring cyan emphasis and the second with white lines for flexible background adaptation.
Related Products
-

Online Shopping Mall System Radial Graph – Dynamic Data Visualization
#Business Introduction #Market and Competitor Analysis #Graph
-

Pentagon Radial Graph & Table – Visualizing Customer Analysis
#Business Introduction #Market and Competitor Analysis #Diagram
-

More Choices in Visual Trends for Effective Presentation Design
#Product/Service Introduction #Business Introduction #Graph
-

Goal Setting & Radial Graph – Intuitive Data Visualization
#Business Introduction #Market and Competitor Analysis #Diagram
