Global Revenue Analysis Table – Table for Financial Performance Enhancement
RM0200016_7
- Last Update 02/06/2025
- File Size 0.7MB
- # of Slides 2
- File Format PPTX
- Slide Ratio 16:9
- Color
Keywords
- #Content-Based Slides
- #Design-Based Slides
- #Financial Plans and Performance
- #Diagram
- #Other
- #Income Statement
- #Sales and Revenue
- #Table
- #Standard Table
- #Map
- #16:9
- #global revenue analysis PowerPoint
- #financial table slide template
- #sales analysis presentation
- #data comparison table PPT
- #financial performance slide
- #revenue reporting PowerPoint template
About the Product
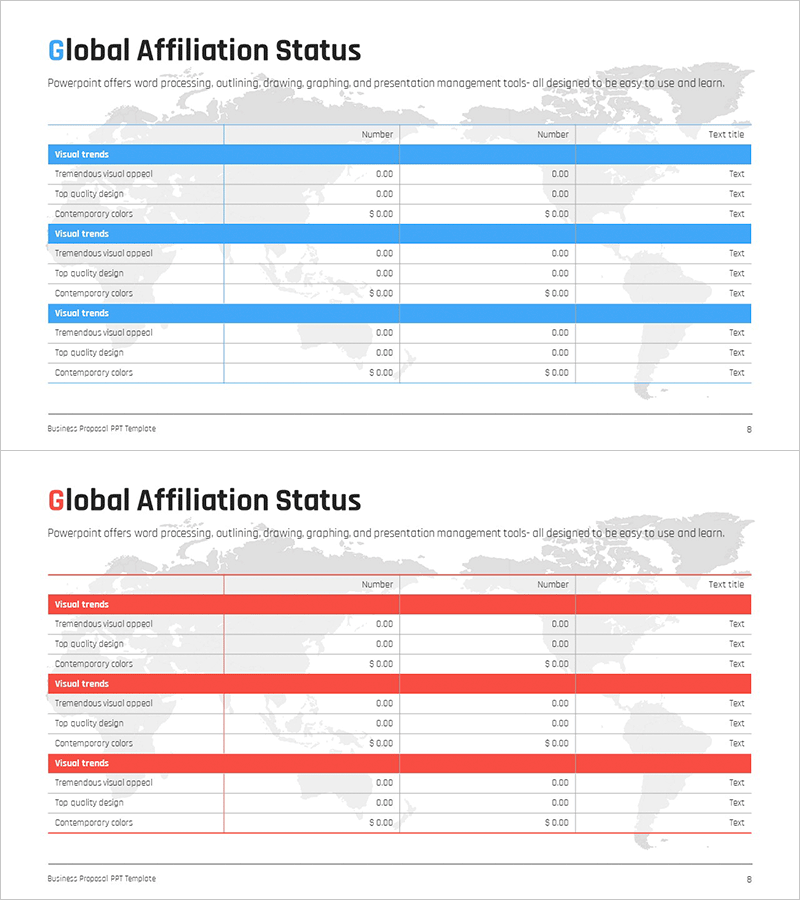
A table-based PowerPoint slide designed for global revenue analysis and financial performance reporting. The slide features a world map background with a structured 3-column data table (Item, Number, Text Title) enabling side-by-side comparison of revenue figures across countries and regions. Ideal for presenting sales analysis, profit & loss statements, and detailed financial metrics in business presentations. The blue header row and white background convey professionalism and clarity. The 2-slide set (16:9 aspect ratio) is ready to edit and integrate into financial performance enhancement presentations.
Usage Points
-
Main Usage
Present country-by-country and region-by-region financial performance data in a structured, easy-to-read table format. Ideal for communicating global business results, profit & loss analysis, and detailed revenue breakdowns in executive presentations.
-
How to Use
Enter actual revenue figures, item names, and descriptions into the table cells positioned over the world map background. The blue header row contains category labels; data rows below display regional or country-specific numbers. Colors and fonts are fully editable to match your corporate branding.
-
Recommended For
CFOs, finance managers, and executives presenting quarterly or annual financial results. Perfect for investor presentations, shareholder meetings, board meetings, financial analysis reports, and multi-country revenue comparison slides in global enterprises.
-
Slide Structure
2-slide set. Each slide displays a light gray world map background with a 3-column data table overlay. The header row features a blue background with white text; data rows alternate between light gray and white backgrounds for improved readability. A 'Text Title' area on the right side accommodates additional explanatory text.
Related Products
-

Bank Income Statement – Visualizing Financial Performance
#Financial Plans and Performance #Diagram #Income Statement
-

Profit Analysis Graph – Visualizing Financial Performance
#Financial Plans and Performance #Diagram #Income Statement
-

Business Income Statement Table – An Essential Tool for Performance Analysis
#Financial Plans and Performance #Diagram #Income Statement
-

Business Income Statement Slide – Table for Financial Clarity
#Financial Plans and Performance #Diagram #Income Statement
