Business Income Statement Slide – Table for Financial Clarity
RJ0300067_19
- Last Update 05/07/2025
- File Size 1.1MB
- # of Slides 2
- File Format PPTX
- Slide Ratio 16:9
- Color
Keywords
- #Content-Based Slides
- #Design-Based Slides
- #Financial Plans and Performance
- #Diagram
- #Income Statement
- #Sales and Revenue
- #Table
- #Standard Table
- #16:9
- #income statement PowerPoint
- #financial table slide
- #financial analysis presentation
- #income statement template
- #financial performance slide
- #business financial report
About the Product
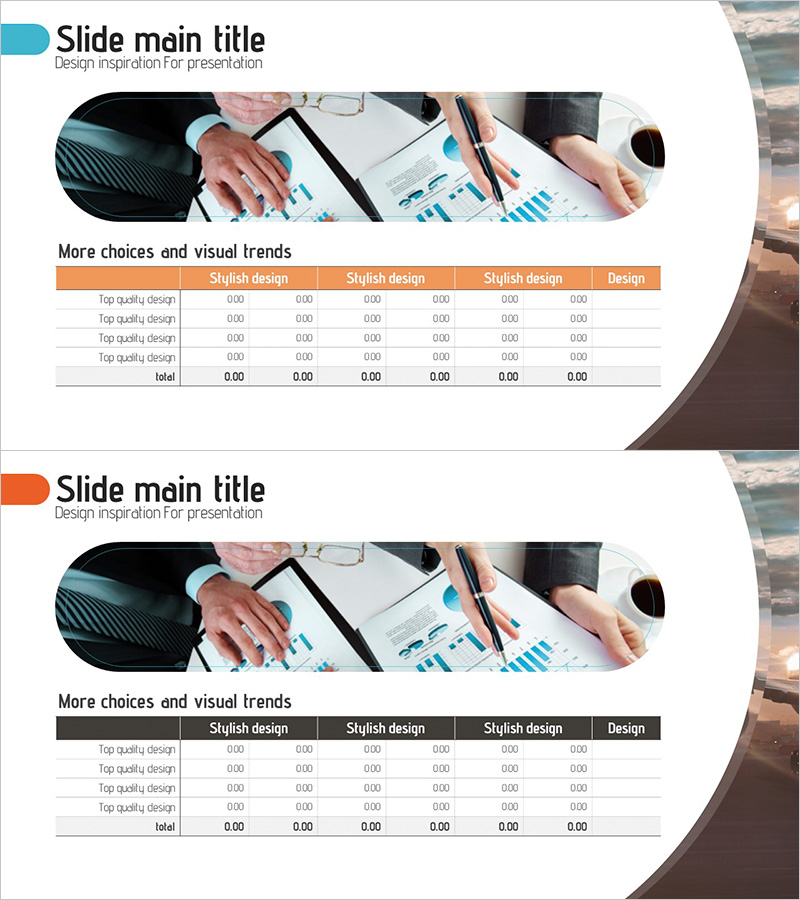
A professional income statement PowerPoint slide designed to clearly present business financial data. This table-format presentation features an orange header and gray row dividers for enhanced data readability, allowing you to compare and analyze revenue, expenses, and profit across 6 columns. The 2-slide set is structured to display various financial metrics and trends at a glance, making it ideal for financial reports, business plans, and investor presentations. Provided in fully editable PPTX format, this slide deck enables CFOs, finance teams, and executives to communicate financial performance with confidence and clarity.
Usage Points
-
Main Usage
This slide is optimized for systematically organizing income statement data and visualizing financial performance. The 6-column layout separates revenue, expenses, and profit figures for easy comparison, while the orange header and gray row dividers create clear information hierarchy and improve readability.
-
How to Use
Use this slide in financial reports, business plans, investor presentations, and quarterly earnings announcements. Simply input your financial data into the existing table structure—no redesign needed. Finance teams and executives can quickly customize the numbers and line items to match their reporting requirements.
-
Recommended For
Ideal for CFOs, finance managers, executives, and investor relations professionals presenting financial performance. Particularly effective for quarterly and annual results analysis, budget-versus-actual comparisons, multi-year trend analysis, and any situation requiring clear quantitative financial communication.
-
Slide Structure
2-slide set, each featuring a table with 6 columns (item label + 5 data columns) and 4–5 rows (revenue, expenses, profit, and other key metrics). Orange header row and alternating gray/white data rows provide visual distinction. Optimized for 16:9 widescreen format.
Related Products
-

Income Statement Results Table - Visualizing Financial Performance
#Financial Plans and Performance #Diagram #Income Statement
-

Sales and Profit Table – Clear Visualization of Financial Planning
#Financial Plans and Performance #Diagram #Other
-

Business Income Statement Table – An Essential Tool for Performance Analysis
#Financial Plans and Performance #Diagram #Income Statement
-

Profit Analysis Graph – Visualizing Financial Performance
#Financial Plans and Performance #Diagram #Income Statement
