Income Statement Results Table - Visualizing Financial Performance
RJ0300077_11
- Last Update 05/10/2025
- File Size 0.9MB
- # of Slides 2
- File Format PPTX
- Slide Ratio 16:9
- Color
Keywords
- #Content-Based Slides
- #Design-Based Slides
- #Financial Plans and Performance
- #Diagram
- #Income Statement
- #Sales and Revenue
- #Table
- #Standard Table
- #16:9
- #income statement table PowerPoint
- #financial performance slide template
- #revenue data table PPT
- #financial report template download
- #business financial data visualization
About the Product
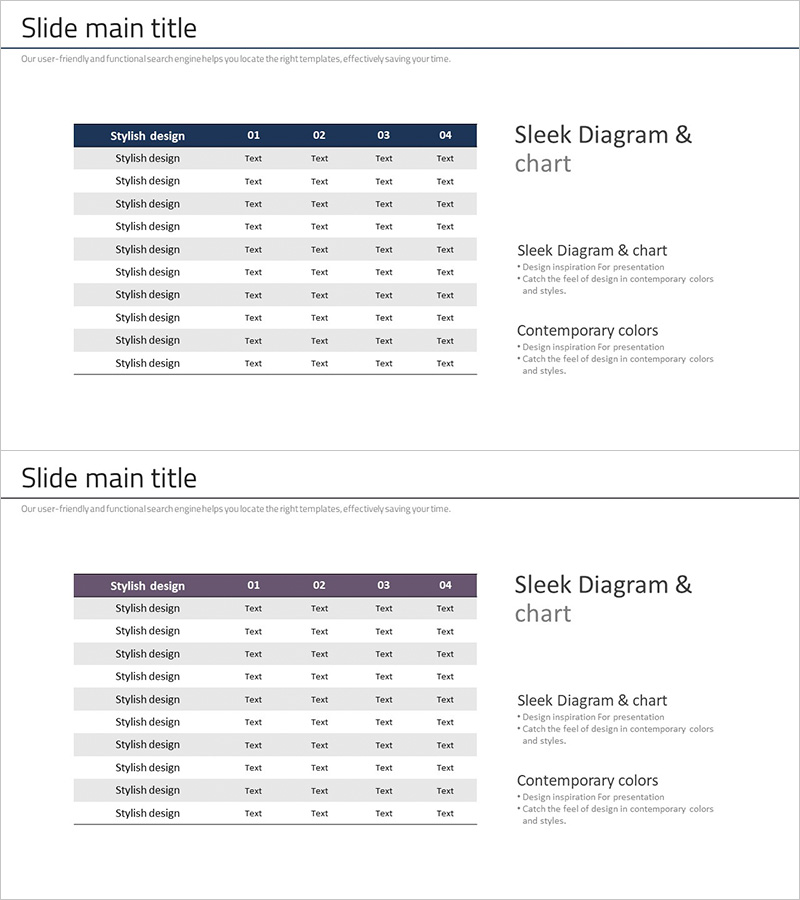
A professional income statement table PowerPoint slide designed to visualize financial performance clearly. The slide features a 10-row by 4-column table structure with a dark navy header row and white text for emphasis, followed by alternating light gray and white data rows that enhance readability. Perfect for presenting revenue, cost of goods sold, operating income, and net income figures in business reports, financial presentations, and investor meetings. The two-slide set provides flexible layout options for various financial data presentations. Fully editable PPTX format allows quick customization of headers, row labels, and numerical data.
Usage Points
-
Main Usage
Presents financial performance analysis and income statement structure in a clear tabular format. Enables comparison of key financial metrics such as revenue, cost of goods sold, operating income, and net income across multiple periods. Ideal for investor presentations, shareholder reports, and executive financial briefings to emphasize financial transparency and performance trends.
-
How to Use
Enter actual financial figures into each table cell. Place account line items (revenue, COGS, operating income, etc.) in the header row and corresponding period-specific values in the data rows. The color-coded row alternation ensures clear visual separation, making large datasets easy to scan and interpret at a glance.
-
Recommended For
CFOs, financial controllers, executives, investor relations professionals, and accounting teams preparing financial reports. Suitable for quarterly earnings presentations, annual financial statements, financial forecast sections in business plans, and investment pitch decks where credible numerical data representation is essential.
-
Slide Structure
Two-slide set featuring a 10-row by 4-column table layout. The first slide displays a dark navy header row (columns 01, 02, 03, 04) with 10 data rows below, alternating between light gray and white backgrounds for visual distinction. The second slide maintains the same structure, accommodating various financial metric combinations and presentation scenarios.
Related Products
-

Business Income Statement Table – An Essential Tool for Performance Analysis
#Financial Plans and Performance #Diagram #Income Statement
-

Business Income Statement – Visualizing Financial Performance
#Financial Plans and Performance #Diagram #Income Statement
-

Sleek Infographic: Modern Colors and Chart Slide Design
#Financial Plans and Performance #Diagram #Income Statement
-

Sales and Profit Table – Clear Visualization of Financial Planning
#Financial Plans and Performance #Diagram #Other
