Sales and Bills Slide for Navigation App
RJ0400039_15
- Last Update 05/28/2025
- File Size 0.4MB
- # of Slides 2
- File Format PPTX
- Slide Ratio 16:9
- Color
Keywords
About the Product
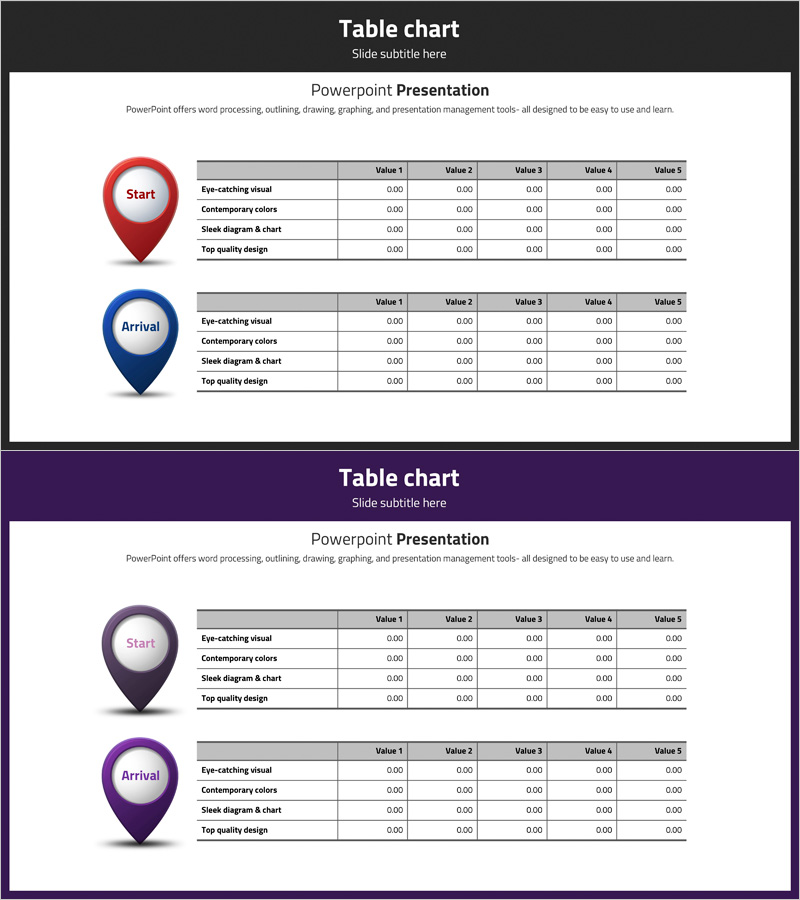
A table slide template for visualizing sales and billing information for navigation and location-based apps. Features red and blue location pin icons to distinguish start and arrival points, with numerical data organized in 5 columns and multiple rows. Ideal for financial reports, profit-and-loss statements, and sales analysis presentations. This PowerPoint slide deck includes 2 slides designed for immediate use in business presentations. The 16:9 widescreen format ensures compatibility with modern presentation environments and professional display standards.
Usage Points
-
Main Usage
Clearly present app-based service revenue, billing items, and financial metrics in tabular format. The row-and-column structure enables audiences to easily compare data across categories. Perfect for investor reports, executive meetings, and quarterly performance presentations.
-
How to Use
Enter sales items (visual elements, colors, diagrams, design quality) in each table row and input corresponding numerical values in the 5 columns. Red pins indicate start stages while blue pins represent arrival stages, making the template suitable for process tracking. Cell background colors and text are fully editable to match your brand guidelines.
-
Recommended For
Recommended for finance teams, marketing departments, and business development teams presenting data-driven insights. Particularly useful for app-based companies, fintech startups, and logistics platforms analyzing revenue and preparing profit-and-loss statements. Suitable for quarterly performance reports, investor pitch decks, and internal management meetings.
-
Slide Structure
2-slide layout with location pin icons (red Start / blue Arrival) positioned on the left side of each slide. The right side features a 4-row by 5-column data table with headers labeled Value 1 through Value 5. Row items include visual elements, colors, diagrams, and design quality. Optimized for 16:9 widescreen presentation format.
Related Products
-

Profit Analysis Graph – Visualizing Financial Performance
#Financial Plans and Performance #Diagram #Income Statement
-

Business Sales and Profit Calculation Table – Essential Slide for Financial Planning
#Financial Plans and Performance #Diagram #Income Statement
-

Visualizing Projected Income, Expenses, and Key Metrics by Business
#Financial Plans and Performance #Diagram #Text Box
-

Income Statement Results Table - Visualizing Financial Performance
#Financial Plans and Performance #Diagram #Income Statement
