Scatter Chart Visualizing the Future Development Direction of the Camping Business
RJ0600032_33
- Last Update 06/29/2025
- File Size 0.8MB
- # of Slides 2
- File Format PPTX
- Slide Ratio 16:9
- Color
Keywords
About the Product
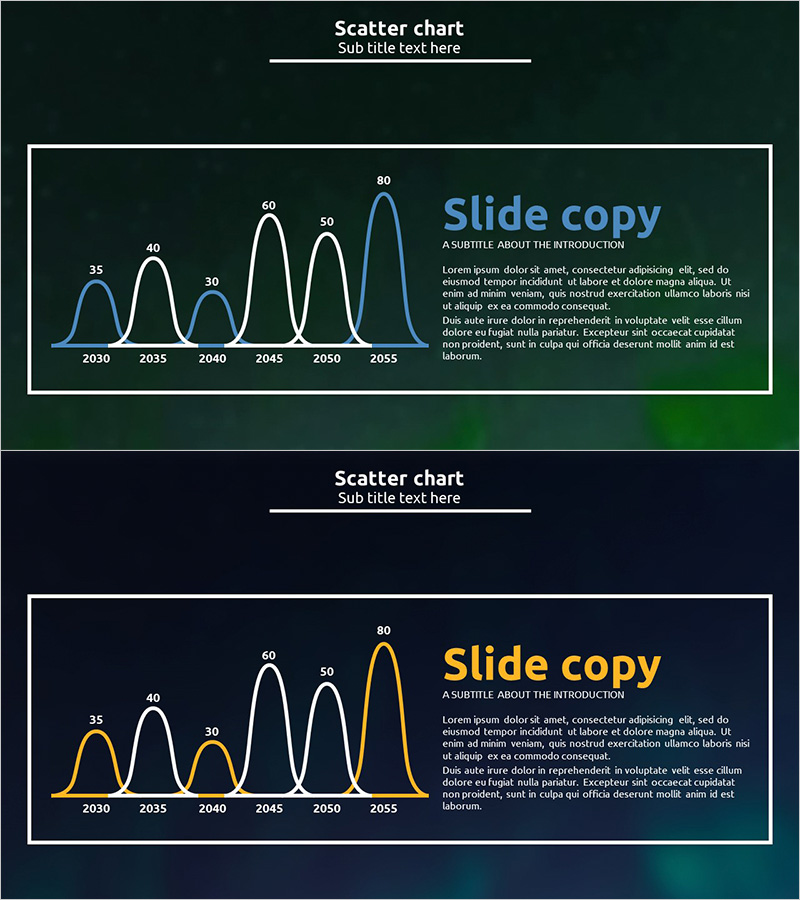
A PowerPoint slide featuring a scatter chart visualizing time series data from 2030 to 2055 with clear numerical labels and trend curves. Set against a dark green background with white lines, this slide is optimized for market trend analysis, business development direction visualization, and competitive advantage assessment. The right side includes a text input area for adding presentation content and insights. Two color variants (blue and orange accent) are provided. Ideal for investor presentations, business reports, and strategic planning sessions where data-driven decision-making is essential.
Usage Points
-
Main Usage
Visualizes time series data trends and patterns through a scatter chart, enabling audiences to quickly grasp market dynamics, business development direction, and competitive positioning. Clear numerical labels and trend curves enhance audience comprehension and support data-driven decision-making in strategic presentations.
-
How to Use
Use in investor presentations, business reports, and strategic planning sessions to substantiate market conditions, business performance, and future plans with data. Enter analysis results and key insights in the right text area to accompany the chart, creating a compelling and evidence-based presentation narrative.
-
Recommended For
Recommended for presentations to executives, investors, and partners; business performance reporting; market analysis result sharing; and future direction statements. Particularly suited for industries where market trends are critical—camping, tourism, consumer goods, finance, and IT—for competitive advantage analysis and strategic positioning.
-
Slide Structure
Comprises a title and subtitle area at the top, a scatter chart on the left-center with X-axis spanning 2030-2055 and Y-axis ranging 35-80, and a text input area on the right with 'slide copy' title and body text. Two color variants (blue and orange accent) allow customization to match presentation theme and corporate branding.
Related Products
-

Double Horizontal Bar Graph for Market Analysis – Competitive Advantage and Future Outlook
#Market and Competitor Analysis #Graph #Future Outlook
-

Analysis of Reading Volume by Data – Market Status and Competitive Advantage
#Market and Competitor Analysis #Diagram #Graph
-

Trend of Comparison Items in Line Chart – Emphasizing Market Outlook
#Market and Competitor Analysis #Graph #Future Outlook
-

Flowering Period Graph – Future Outlook Analysis
#Market and Competitor Analysis #Graph #Future Outlook
