Create Line Charts with Rainbow Paper Template
RJ0200024_18
- Last Update 04/04/2025
- File Size 2.6MB
- # of Slides 2
- File Format PPTX
- Slide Ratio 16:9
- Color
Keywords
About the Product
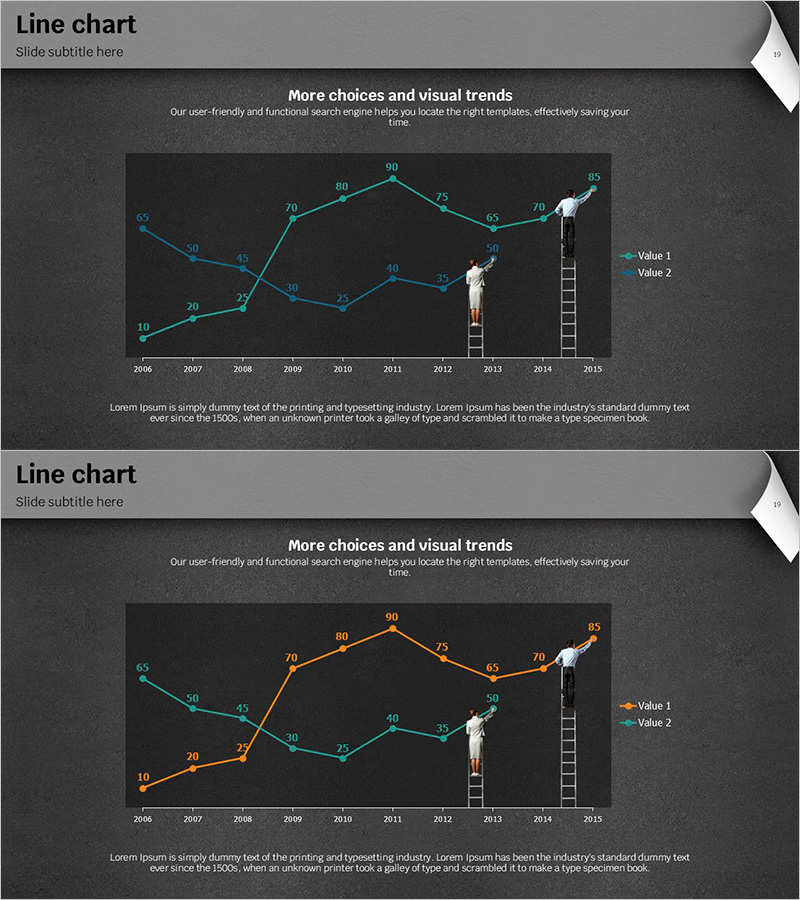
A professional line chart PowerPoint slide tracking data changes from 2006 to 2015 across a decade. The slide features two data series in cyan and orange colors, ideal for competitive analysis, market share trends, revenue progression, and performance metrics. Set against a dark background with clear data points and numeric labels, this slide design ensures audience focus during presentations. The 2-slide set offers the same data visualization in different color combinations, making it instantly applicable to business reports, pitch decks, marketing plans, and strategic presentations.
Usage Points
-
Main Usage
This slide is optimized for expressing numerical changes and trends over time with clarity and impact. The dual-series format enables simultaneous comparison of two datasets, making it ideal for competitive benchmarking, market share evolution, revenue and cost analysis, customer satisfaction trends, and other critical business metrics.
-
How to Use
Insert into market analysis, performance reporting, and future outlook sections of presentations to support data-driven decision-making. The dark background and clear labeling ensure excellent readability in large conference rooms and projection settings. The 2-slide variation allows you to present alternative color schemes based on audience feedback or brand guidelines.
-
Recommended For
Executive reports, quarterly performance reviews, investor pitch decks, marketing strategy presentations, and business plans benefit from this template. Primary users include C-suite executives, planning teams, marketing departments, and sales teams in finance, IT, manufacturing, and retail sectors where data-driven insights are critical.
-
Slide Structure
Each slide features a 10-year X-axis timeline (2006–2015), a numeric Y-axis scale, and two line series in contrasting colors. Data points include numeric labels for precision, with a legend distinguishing Value 1 and Value 2. A title area at the top and descriptive text space at the bottom allow for easy customization and context addition.
Related Products
-

Real Estate Construction Status Graph – Market Analysis and Future Forecast
#Market and Competitor Analysis #Graph #Future Outlook
-

Analysis of Reading Volume by Data – Market Status and Competitive Advantage
#Market and Competitor Analysis #Diagram #Graph
-

Sales Performance Comparison Slide – Market Analysis and Competitive Edge
#Market and Competitor Analysis #Graph #Future Outlook
-

Forward-looking Line Chart – Market Growth Prediction
#Market and Competitor Analysis #Graph #Future Outlook
