Analysis of Major Business Marketing Activities – Green Mint
RJ0600048_27
- Last Update 07/03/2025
- File Size 1.8MB
- # of Slides 2
- File Format PPTX
- Slide Ratio 16:9
- Color
Keywords
- #Content-Based Slides
- #Design-Based Slides
- #Product/Service Introduction
- #Marketing Plan and Strategy
- #Graph
- #Other
- #Development Status
- #Key Marketing Activities
- #16:9
- #marketing activities proportion analysis PowerPoint
- #marketing comparison slide deck
- #5-item bar chart PPT
- #business marketing analysis presentation
- #how to visualize marketing data in PowerPoint
About the Product
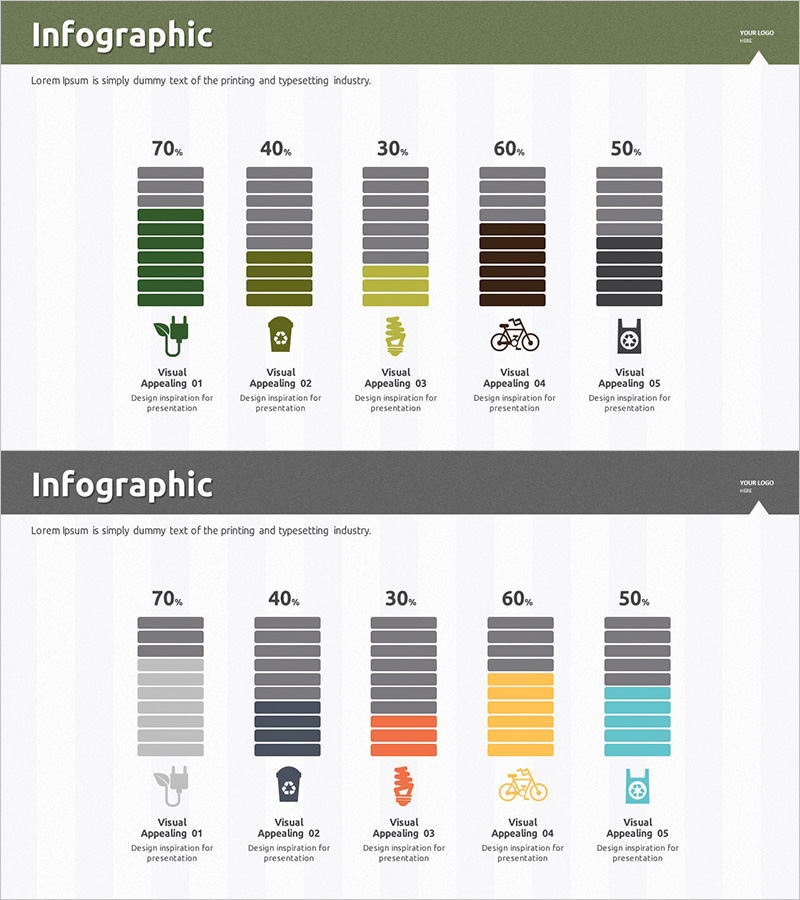
A PowerPoint slide that visualizes the proportion of five major business marketing activities using horizontal stacked bar charts. Each item displays percentages (70%, 40%, 30%, 60%, 50%) with a layered color scheme in green, olive, yellow, brown, and charcoal tones for enhanced data readability. The slide features a header area for company logo placement and a footer for page information. Icons below each item (plant, ecology, bicycle, recycling) strengthen category visualization. The 2-slide set includes identical layouts in two color variations (green tone and gray tone) for flexible presentation styling. Fully editable PPTX format ready for immediate use.
Usage Points
-
Main Usage
This data visualization slide supports business strategy presentations by comparing the relative proportion of marketing activities at a glance. The horizontal bar chart displays five marketing channels, activities, or investment items as percentages, enabling executives, team members, and investors to quickly understand the current marketing portfolio composition.
-
How to Use
Insert this slide into marketing strategy documents, business plans, or quarterly performance reports within the marketing section to visualize activity proportion analysis. Modify the percentage values and colors to match your data, and replace icons with corresponding marketing activity names. Choose between the green-tone or gray-tone layout variant based on your presentation's overall design theme.
-
Recommended For
Marketing managers, planning teams, and executives use this slide when analyzing and reporting marketing portfolio status. It is particularly effective for comparing investment proportions across diverse marketing channels (digital, offline, events, PR, partnerships) or tracking marketing activity changes across quarters or years in executive presentations.
-
Slide Structure
Header area (title and logo space) + main content (five horizontal stacked bar charts with percentage values and icons) + footer area (page information). Each item consists of an independent bar chart with layered colors (top gray + middle green/olive/yellow/brown + bottom charcoal) representing data hierarchy. Five editable text fields (item names and percentages) allow quick customization.
Related Products
-

Donut Chart Slide for Major Cultivation Countries
#Product/Service Introduction #Market and Competitor Analysis #Graph
-

Data Analysis Status Pie Chart – A Tool for Clear Understanding
#Product/Service Introduction #Graph #Other
-

Filming Progress Status Analysis Graph – Clear Marketing Strategy Visualization
#Product/Service Introduction #Marketing Plan and Strategy #Diagram
-

Visualizing Experimental Results with Bar Chart Slide
#Product/Service Introduction #Market and Competitor Analysis #Graph
