Social Network Market Analysis Bar Chart – Trends Insight
RJ0400068_21
- Last Update 06/05/2025
- File Size 1.9MB
- # of Slides 2
- File Format PPTX
- Slide Ratio 16:9
- Color
Keywords
- #Content-Based Slides
- #Design-Based Slides
- #Product/Service Introduction
- #Market and Competitor Analysis
- #Graph
- #Other
- #Development Status
- #Market Analysis
- #Column
- #Segmented Column
- #Mockup
- #16:9
- #segmented bar chart PowerPoint
- #stacked bar graph template
- #market analysis slide
- #data visualization PPT
- #year-over-year comparison chart
About the Product
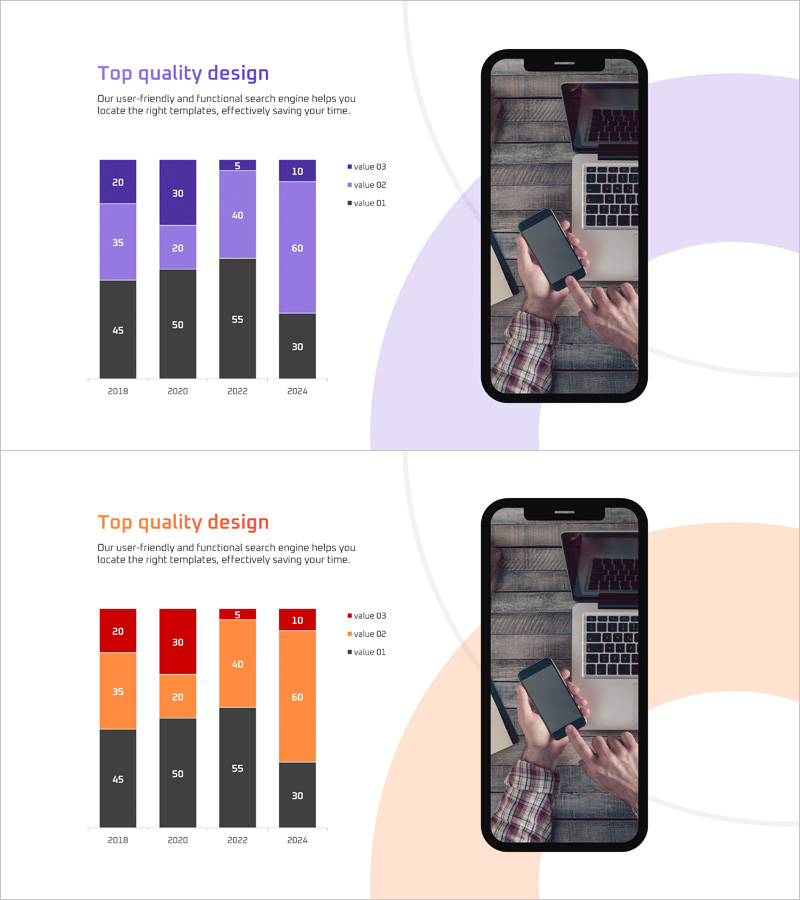
A segmented bar chart PowerPoint slide designed for analyzing social network market trends. This presentation template displays four data series (value 03, 02, 01) across years 2018 to 2024 in a stacked bar format, enabling year-over-year comparison. The color scheme combines purple, orange, and black tones for clear visual distinction, with a legend that facilitates intuitive data interpretation. The slide is ready to use in business reports, market analysis presentations, and strategic planning decks to compare market size, growth rates, and market share.
Usage Points
-
Main Usage
Ideal for comparing multiple data sets—such as market size, growth rates, and market share—across different time periods. This slide excels in social network, digital platform, and online service market presentations, providing quantitative evidence in a visually compelling format.
-
How to Use
Simply replace the numerical values in each bar segment with your own data for immediate use. Adjust colors to emphasize year-over-year trends or highlight specific data series growth, and customize legend labels to match your presentation context.
-
Recommended For
Marketing professionals, business strategists, data analysts, and executives presenting market insights will find this slide invaluable. Use it in investor presentations, business plan pitches, and quarterly performance reports to clearly visualize competitive positioning and market share evolution.
-
Slide Structure
Two-slide layout, each featuring a stacked bar chart representing four years (2018, 2020, 2022, 2024). Each bar is segmented into 3–4 data series with a legend for clarity. The 16:9 widescreen format ensures optimal display on projectors and modern monitors.
Related Products
-

Bar Graph of Progress Analysis by Task - Effective Visualization of Progress
#Product/Service Introduction #Market and Competitor Analysis #Marketing Plan and Strategy
-

Vertical Bar Chart Visualizing Monthly Performance – Contemporary Design
#Product/Service Introduction #Market and Competitor Analysis #Graph
-

Business Goal Analysis Graph – Realizing Business Vision
#Business Vision and Strategy #Market and Competitor Analysis #Diagram
-

Visualizing Bar Graphs with PC Mockups – Competitive Market Analysis Tool
#Market and Competitor Analysis #Graph #Other
