Camera Donut Chart and Table – Market and Competitive Analysis
RJ0500021_31
- Last Update 06/12/2025
- File Size 0.7MB
- # of Slides 2
- File Format PPTX
- Slide Ratio 16:9
- Color
Keywords
- #Content-Based Slides
- #Design-Based Slides
- #Product/Service Introduction
- #Market and Competitor Analysis
- #Graph
- #Other
- #Development Status
- #Competitive Advantage
- #Circles
- #Doughnut Chart
- #16:9
- #donut chart PowerPoint slide
- #pie chart presentation template
- #ratio analysis slide
- #data visualization PowerPoint
- #competitive analysis template
- #market share chart slide
About the Product
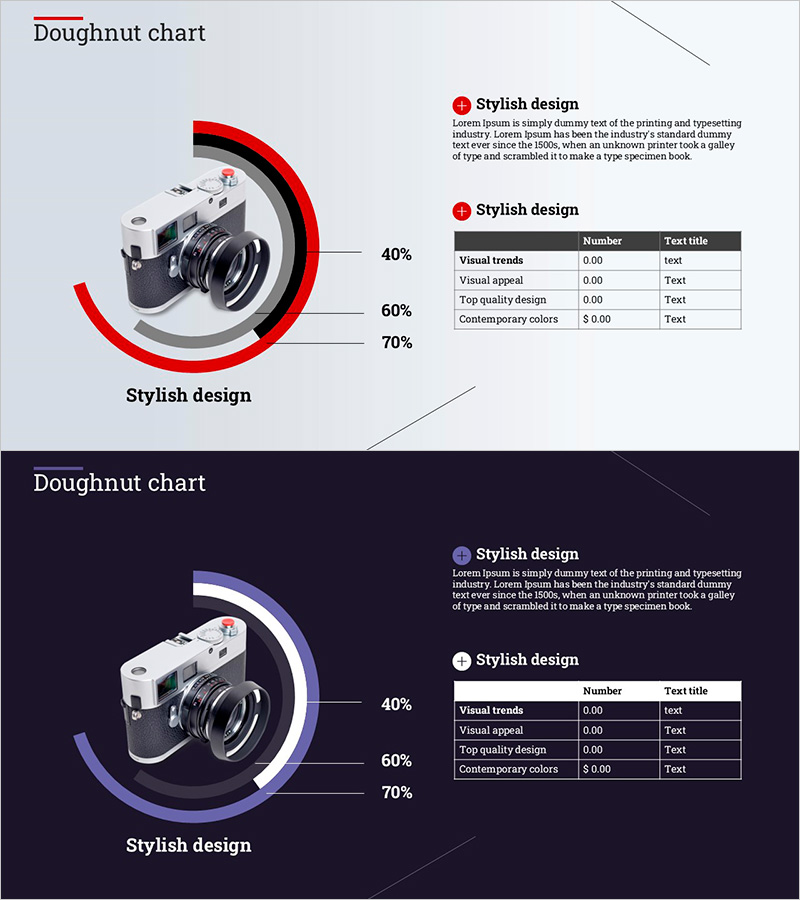
A professional donut chart PowerPoint slide featuring a camera product image with three-level percentage visualization (40%, 60%, 70%). The design combines a centered donut ring in red accent color with a data table on the right side for clear numerical representation. Built on a light gray background with supporting dark theme variant, this slide is ideal for market analysis, competitive comparison, and product performance evaluation presentations. The two-slide set includes both light and dark theme versions to match your presentation style. Fully editable PPTX format ready for immediate customization.
Usage Points
-
Main Usage
Visualize product performance metrics, market share, and competitive positioning using a donut chart format with accompanying data table. The camera mockup integration makes it particularly effective for product introduction and marketing presentations requiring visual impact.
-
How to Use
Use in product launch presentations, market analysis reports, competitive analysis documents, and sales performance reviews. Simply replace the percentage values and table data with your own information. Customize ring colors and text to match your brand guidelines.
-
Recommended For
Marketing managers, product strategists, sales teams, and executives preparing business reports. Especially recommended for C-level presentations where visual clarity and data credibility are essential for decision-making.
-
Slide Structure
Slide 1 (Light Theme): Light gray background with left-aligned camera mockup, center donut chart showing three percentage levels with red accent rings, right-aligned 4-row data table. Slide 2 (Dark Theme): Dark navy background with identical layout using purple accent rings. 16:9 widescreen format, 2-slide set.
Related Products
-

Competitive Advantage Analysis Silhouette Graph – Market and Competitor Insights
#Product/Service Introduction #Market and Competitor Analysis #Graph
-

Social Network Target Market Analysis – Insights and Strategies
#Product/Service Introduction #Market and Competitor Analysis #Graph
-

Visualizing Competitive Advantage with Circular Gauge Charts
#Product/Service Introduction #Market and Competitor Analysis #Graph
-

Technology Achievement Donut Chart
#Product/Service Introduction #Business Introduction #Graph
