Table of Contents for Business Success – Financial Planning and Performance
RJ0300053_17
- Last Update 05/02/2025
- File Size 1.6MB
- # of Slides 2
- File Format PPTX
- Slide Ratio 16:9
- Color
Keywords
About the Product
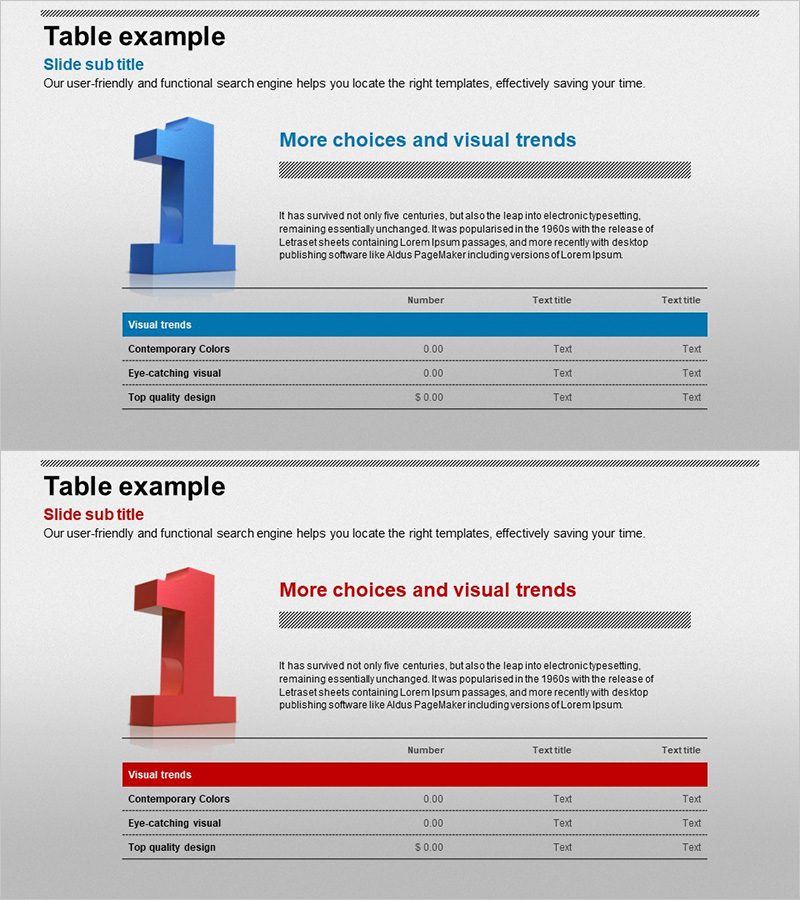
A professional 3-row data table PowerPoint slide designed to present financial performance, business metrics, and income statements with clarity. Two color versions—blue header and red header—allow you to match your presentation tone and subject matter. Each table features three columns (Number, Text title, Text title) for flexible data entry including financial plans, KPIs, profit-and-loss statements, and performance indicators. Optimized for 16:9 widescreen format across 2 slides, ready to edit and integrate into your business presentations immediately.
Usage Points
-
Main Usage
Visualize financial data, performance metrics, and income statements in a structured table format to enhance audience comprehension. Two color versions—blue for positive/growth narratives and red for caution/attention—enable tonal differentiation aligned with your message.
-
How to Use
Input item names, numerical values, and descriptions into the three columns of each table to organize financial data and performance summaries. Deploy in business plans, quarterly performance reports, investor pitch decks, and executive briefings to present data comparisons and performance analysis sections.
-
Recommended For
CFOs, finance managers, executives, business development teams, and consultants who regularly report financial data and performance indicators. Ideal for quarterly earnings presentations, investor meetings, and internal management reviews requiring credible data visualization.
-
Slide Structure
Two slides featuring identical 3-row table layouts with three columns (Number, Text title, Text title) in blue header and red header versions respectively. Optimized for 16:9 widescreen displays with fully editable cells supporting numbers, text, currency symbols, and custom formatting.
Related Products
-

Sales and Profit Table – Visualizing Financial Performance
#Financial Plans and Performance #Diagram #Other
-

Visualizing Projected Income, Expenses, and Key Metrics by Business
#Financial Plans and Performance #Diagram #Text Box
-

Orange Green Profit and Loss Chart – Visualizing Revenue and Profit
#Financial Plans and Performance #Diagram #Graph
-

Profit Analysis Graph – Visualizing Financial Performance
#Financial Plans and Performance #Diagram #Income Statement
