Competitor Analysis Graph for Market Capture
RJ0700016_11
- Last Update 07/26/2025
- File Size 0.4MB
- # of Slides 2
- File Format PPTX
- Slide Ratio 16:9
- Color
Keywords
About the Product
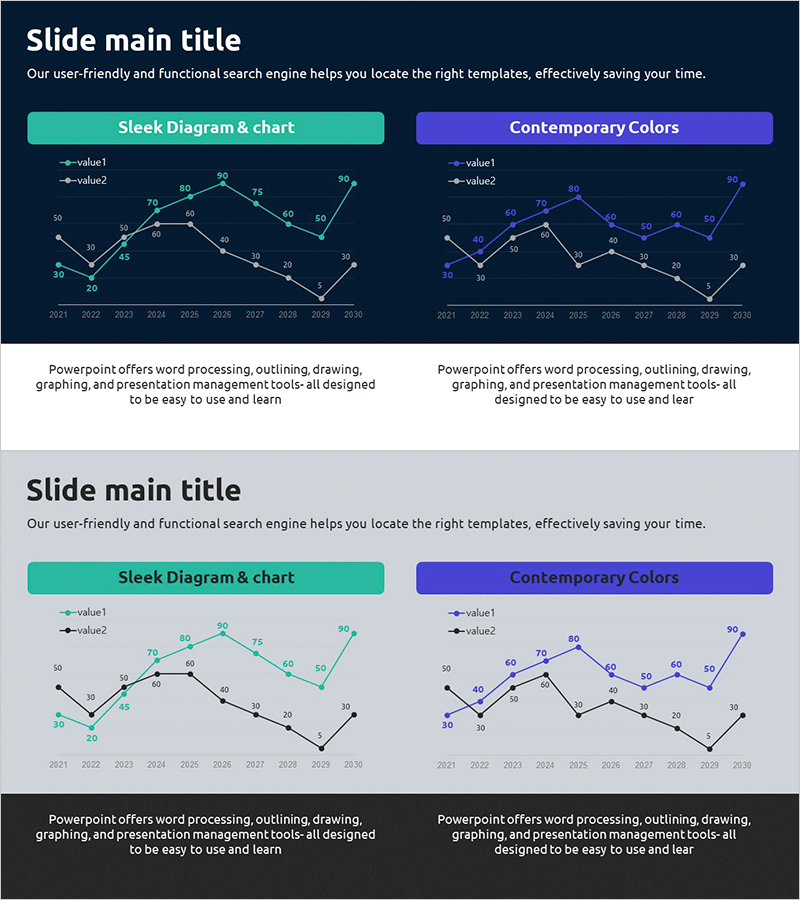
A dual-series line chart PowerPoint slide that visualizes data changes across a 10-year period from 2021 to 2030. Two distinct data lines in turquoise and navy blue clearly differentiate the trends, with numeric labels at each data point for precise value comparison. The bright-colored lines stand out against the dark background, maximizing visual contrast and readability. This slide is ready to use for competitor analysis, market trend presentations, sales performance tracking, and other business data visualization needs.
Usage Points
-
Main Usage
This slide is optimized for comparing and analyzing changes in two or more data series over time. It effectively communicates competitor performance trends, market share evolution, sales growth patterns, customer satisfaction changes, and other longitudinal business metrics with visual clarity.
-
How to Use
The two data series are clearly distinguished by color and legend, with numeric labels at each data point emphasizing exact values. The bright-colored lines on a dark background ensure excellent readability on large presentation screens. Simply copy and paste your data into the underlying spreadsheet to automatically update the chart.
-
Recommended For
Ideal for executive reports, quarterly performance presentations, market analysis documents, competitive strategy meetings, investor relations presentations, and marketing strategy briefings. Recommended for executives, data analysts, marketing professionals, and sales leaders who need to support data-driven decision-making.
-
Slide Structure
The slide features a dual-series line chart with 10 data points per line spanning 2021 to 2030. The turquoise line (value1) and navy blue line (value2) intersect and diverge throughout the timeline, with all values labeled for precise comparison. A title area at the top allows you to specify the analysis topic.
Related Products
-

Project Market Environment Analysis Chart – Powerful Competitive Strategy
#Market and Competitor Analysis #Graph #Competitor Analysis
-

Competitor Analysis Broken Line Graph
#Market and Competitor Analysis #Graph #Competitor Analysis
-

Virus Analysis Broken Line Graph – Market and Competitor Analysis
#Market and Competitor Analysis #Graph #Competitor Analysis
-

Market Analysis Graph & Notebook Mockup – Understanding the Market through Data Visualization
#Market and Competitor Analysis #Graph #Other
