Space Illustration Theme Broken Line Graph
RJ0700022_11
- Last Update 07/28/2025
- File Size 0.3MB
- # of Slides 2
- File Format PPTX
- Slide Ratio 16:9
- Color
Keywords
About the Product
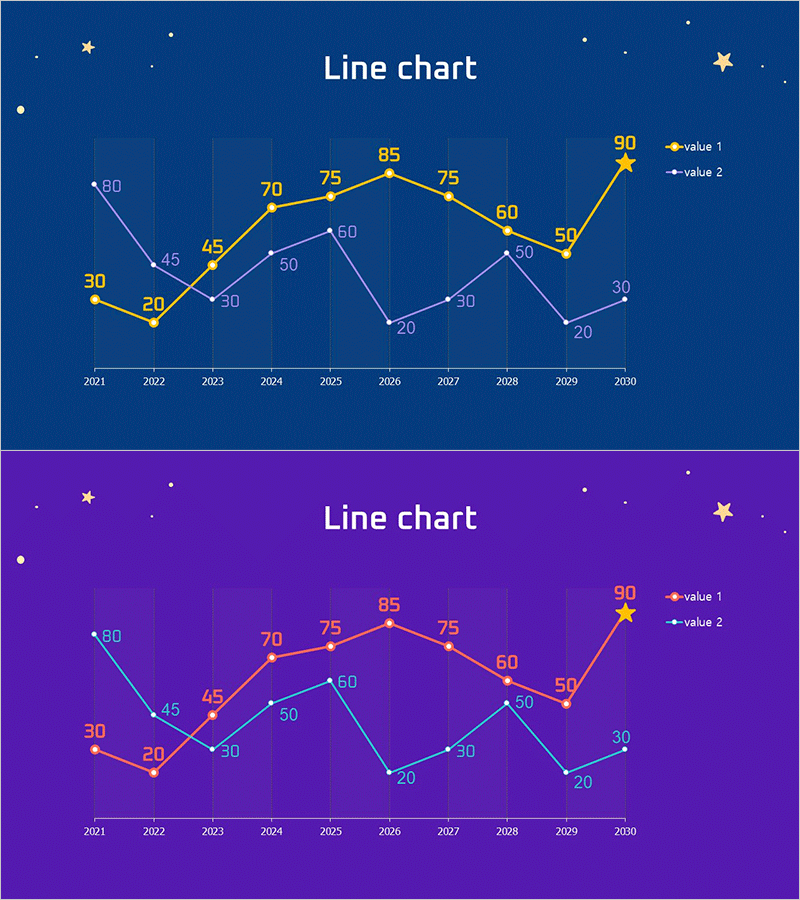
A dual-series line chart PowerPoint slide featuring a space illustration theme background. This presentation template visualizes 10-year data trends from 2021 to 2030, tracking two data series (value 1 and value 2) with precise numerical labels at each data point. Available in dark blue and purple background options, the slide incorporates star decorations and grid patterns to enhance the cosmic aesthetic. Ideal for market analysis presentations, competitive benchmarking reports, and performance trend discussions in business settings.
Usage Points
-
Main Usage
Compares two or more data series over time to reveal trends, correlations, and performance gaps. Effectively communicates market share evolution, competitive performance comparison, annual revenue progression, customer satisfaction trends, and multi-metric KPI tracking across extended periods.
-
How to Use
Double-click each data point value to input your actual figures; the chart updates automatically. Edit the legend labels (value 1, value 2) to match your metrics, and adjust the x-axis labels (2021–2030) to your reporting period. Switch between dark blue and purple backgrounds via theme color options to match your presentation style.
-
Recommended For
Marketing professionals presenting market analysis, sales teams comparing competitor performance, executives reviewing annual results, investors evaluating growth trajectories, and consulting firms presenting trend research. The space theme adds visual interest and memorability to strategic presentations.
-
Slide Structure
Two-slide set: dark blue background version and purple background version. Each slide contains a title area, dual-series line chart with 10 data points, legend box, and grid background. All elements are fully editable PowerPoint objects with no locked layers.
Related Products
-

Market Analysis Graph & Notebook Mockup – Understanding the Market through Data Visualization
#Market and Competitor Analysis #Graph #Other
-

Year-by-year Growth Trend Graph – Market and Competitor Analysis
#Market and Competitor Analysis #Graph #Competitor Analysis
-

Line Graph and Clustered Column Graph – Essential for Competitor Analysis
#Market and Competitor Analysis #Graph #Competitor Analysis
-

Interior Market Analysis Graph – Insights into Market Status
#Market and Competitor Analysis #Diagram #Graph
