Gradient Line Graph – Market and Competitor Analysis
RJ0700015_9
- Last Update 07/26/2025
- File Size 0.4MB
- # of Slides 2
- File Format PPTX
- Slide Ratio 16:9
- Color
Keywords
About the Product
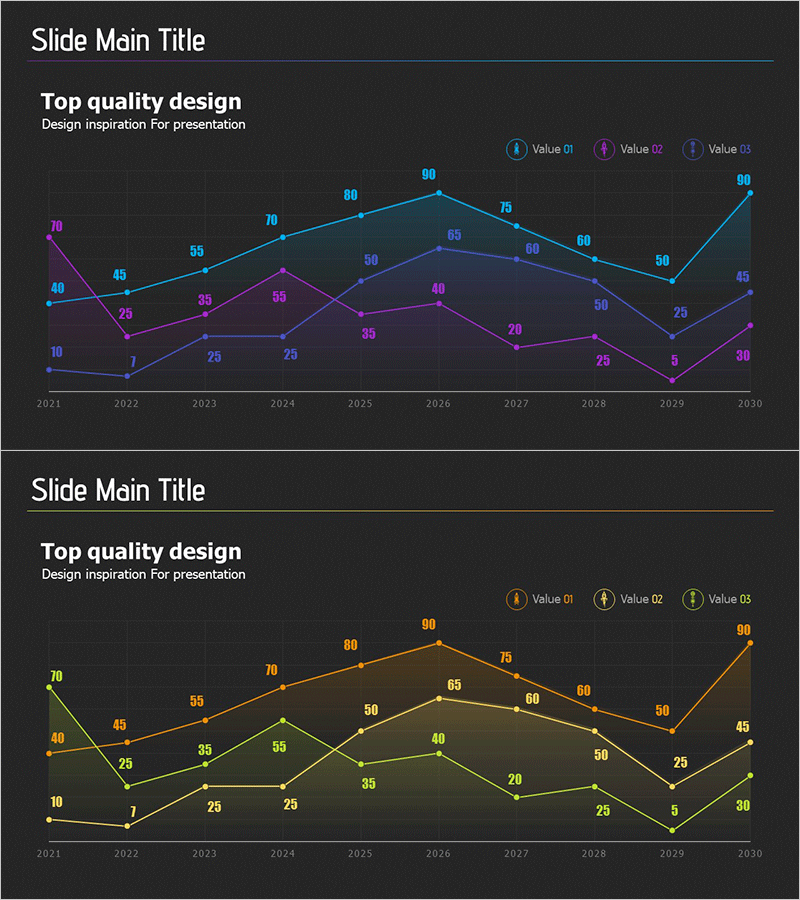
A multi-series line chart PowerPoint slide visualizing 10-year data trends from 2021 to 2030 across three distinct data series. Set against a dark background with cyan, purple, and yellow gradient lines, this slide is optimized for market trends, competitor performance, revenue growth, and complex data comparisons. Each data point is labeled with numerical values for precise reference during presentations, and a legend clearly distinguishes the three series. The 2-slide set provides layout variations, enabling immediate application across multiple analytical topics and reporting scenarios.
Usage Points
-
Main Usage
Compare long-term trend data across three or more series simultaneously. Ideal for visualizing market size evolution, competitor performance benchmarking, departmental revenue trajectories, and customer satisfaction trends. Enables multi-dimensional insights and data-driven decision-making in executive presentations.
-
How to Use
Double-click each data point to input values; the line automatically updates. Modify legend labels to reflect your actual analysis categories and adjust series colors as needed. Both slides share identical structure, so copy and paste them across different analytical topics for consistent formatting.
-
Recommended For
Executive reports, business plans, marketing analysis documents, investor presentations, quarterly performance reviews, and market research reports. Ideal for executives, analysts, marketing managers, and finance professionals who need to emphasize data-driven insights.
-
Slide Structure
Both slides feature identical layout: title area, 3-series legend (cyan, purple, yellow), 10-point timeline (2021–2030), and 10 data points per series. Dark background with gradient lines and numerical labels ensure high contrast and readability for audience engagement.
Related Products
-

Competitor Technology Comparison Graph – Market and Competitor Analysis
#Market and Competitor Analysis #Graph #Competitor Analysis
-

Competitor Analysis Broken Line Graph
#Market and Competitor Analysis #Graph #Competitor Analysis
-

Competitor Analysis Broken Line Graph – Market Insights Provided
#Market and Competitor Analysis #Graph #Competitor Analysis
-

Line Graph and Clustered Column Graph – Essential for Competitor Analysis
#Market and Competitor Analysis #Graph #Competitor Analysis
