Business Performance Analysis Graph – Vertical Bars
RJ0300018_11
- Last Update 04/22/2025
- File Size 2.7MB
- # of Slides 2
- File Format PPTX
- Slide Ratio 16:9
- Color
Keywords
- #Content-Based Slides
- #Design-Based Slides
- #Business Strategy
- #Graph
- #Financial Outlook & Expected Impact
- #Achievements
- #Column
- #Segmented Column
- #16:9
- #vertical bar chart PowerPoint
- #bar graph slide template
- #business performance analysis chart
- #data comparison PowerPoint slide
- #how to create bar chart in PowerPoint
About the Product
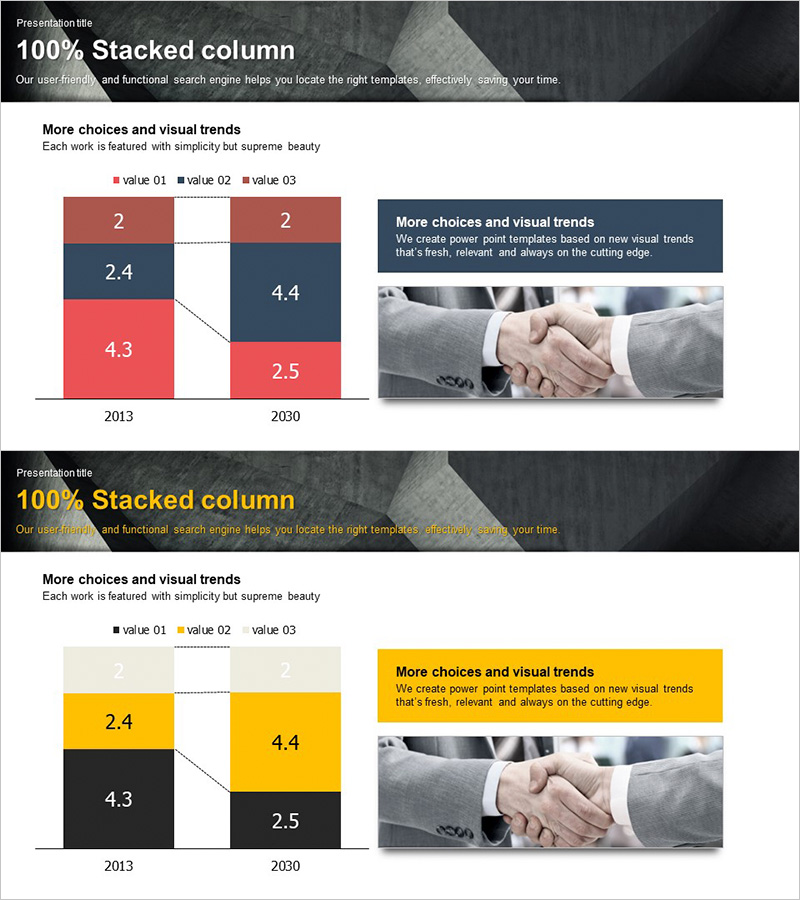
A vertical bar chart PowerPoint slide optimized for business performance analysis and comparative data visualization. The slide displays data across two time periods (2013 and 2030) with three distinct series (value 01, 02, 03) represented in red, gray, and navy blue tones for clear differentiation. The 16:9 widescreen format with 2-slide composition enables immediate integration into presentations, making numerical comparisons intuitive and professional. Each bar group is labeled with precise values, facilitating quick interpretation of performance metrics and trends across multiple categories.
Usage Points
-
Main Usage
Comparative visualization of performance metrics across years, departments, or product lines using three data series. The bar height differences convey numerical variations intuitively, making it ideal for executive reports, quarterly performance reviews, and marketing analysis presentations.
-
How to Use
Replace the sample numerical values with your actual performance data. Modify the legend labels (value 01, 02, 03) to match your category names, then adjust bar heights and colors to correspond with your dataset. The template is fully editable and ready for immediate use.
-
Recommended For
Finance, marketing, sales, and operations professionals presenting performance analysis. Suitable for executive briefings, quarterly and annual results presentations, departmental performance comparisons, investor relations materials, and business performance dashboards.
-
Slide Structure
Two-slide composition: the first slide displays 2013 data with three bar groups, and the second slide shows 2030 data with corresponding three bar groups. Each slide includes legend, axis labels, and numerical annotations. The 16:9 widescreen layout is optimized for large-screen presentations and modern display formats.
Related Products
-

Graph of Future Development of Calligraphy – Revenue Projections and Expectations
#Business Strategy #Technical Approach #Graph
-

Vertical Bar Chart for Achieving Goals – Growth and Fulfillment
#Business Strategy #Graph #Financial Outlook & Expected Impact
-

Subdivision Vertical Graph Comparison Type – Optimal for Business Strategy Analysis
#Business Strategy #Market and Competitor Analysis #Graph
-

Travel Competitor Analysis Vertical Bar Graph – Business Strategy
#Business Strategy #Graph #Financial Outlook & Expected Impact
